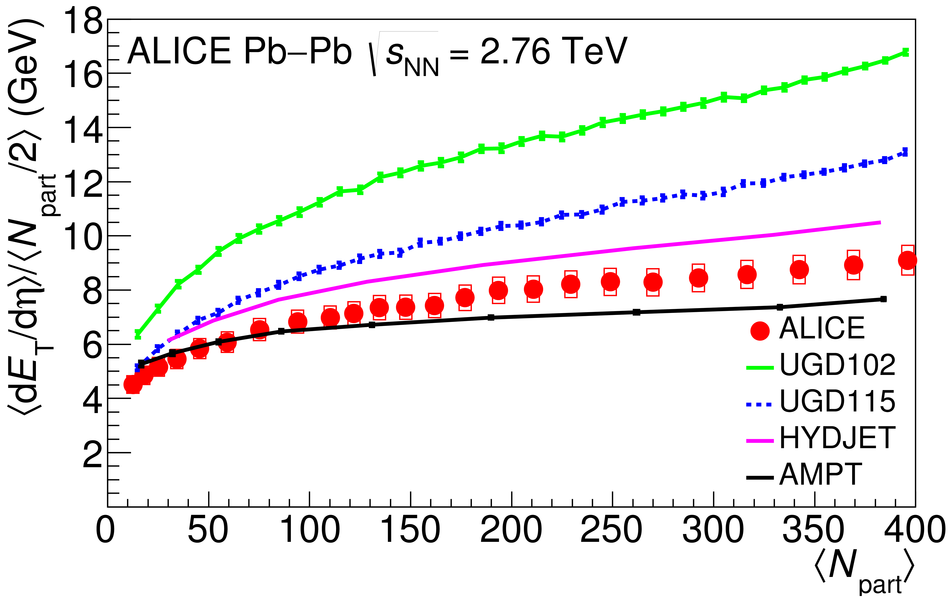
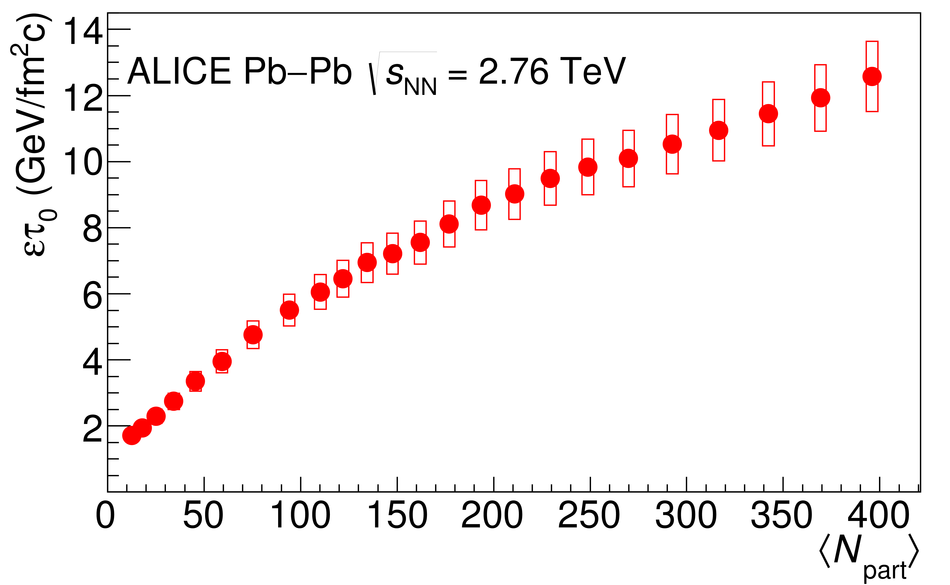
We report the transverse energy ($E_{\mathrm T}$) measured with ALICE at midrapidity in Pb-Pb collisions at ${\sqrt{s_{\mathrm {NN}}}}$ = 2.76 TeV as a function of centrality. The transverse energy was measured using identified single particle tracks. The measurement was cross checked using the electromagnetic calorimeters and the transverse momentum distributions of identified particles previously reported by ALICE. The results are compared to theoretical models as well as to results from other experiments. The mean $E_{\mathrm T}$ per unit pseudorapidity ($\eta$), $\langle $d$E_{\mathrm T}/$d$\eta \rangle$, in 0-5% central collisions is 1737 $\pm$ 6(stat.) $\pm$ 97(sys.) GeV. We find a similar centrality dependence of the shape of $\langle $d$E_{\mathrm T}/$d$\eta \rangle$ as a function of the number of participating nucleons to that seen at lower energies. The growth in $\langle $d$E_{\mathrm T}/$d$\eta \rangle$ at the LHC ${\sqrt{s_{\mathrm {NN}}}}$ exceeds extrapolations of low energy data. We observe a nearly linear scaling of $\langle $d$E_{\mathrm T}/$d$\eta \rangle$ with the number of quark participants. With the canonical assumption of a 1 fm/$c$ formation time, we estimate that the energy density in 0-5% central Pb-Pb collisions at ${\sqrt{s_{\mathrm {NN}}}}$ = 2.76 TeV is 12.3 $\pm$ 1.0 GeV/fm$^3$\xspace and that the energy density at the most central 80 fm$^2$ of the collision is at least 21.5 $\pm$ 1.7 GeV/fm$^3$. This is roughly 2.3 times that observed in 0-5% central Au-Au collisions at ${\sqrt{s_{\mathrm {NN}}}}$ = 200 GeV.
Phys. Rev. C 94 (2016) 034903
HEP Data
e-Print: arXiv:1603.04775 | PDF | inSPIRE
CERN-EP-2016-071
Figure 1
Fraction of the total $E_{\mathrm T}$ in pions ($f_{\pi}$), kaons ($f_{\mathrm K}$), p and $\overline{p}$ ($f_{{\mathrm p}}$), and $\Lambda$ ($f_{\Lambda}$) and the correction factors $f_{\mathrm{total}}$, $f_{\mathrm{neutral}}$, and $f_{\mathrm{em}}$ as a function of $\langle N_{\mathrm{part}} \rangle$. The fraction $f_{\Lambda}$ is scaled by a factor of two so that the data do not overlap with those from protons. Note that $f_{\mathrm{neutral}}$ is the fraction of $E_{\mathrm T}^{\mathrm{had}}$ measured in the tracking detectors while $f_{\mathrm{total}}$ and $f_{\mathrm{em}}$ are the fractions of the total $E_{\mathrm T}$ measured in the tracking detectors and the calorimeters, respectively. The vertical error bars give the uncertainty on the fraction of $E_{\mathrm T}$ from the particle yields. | 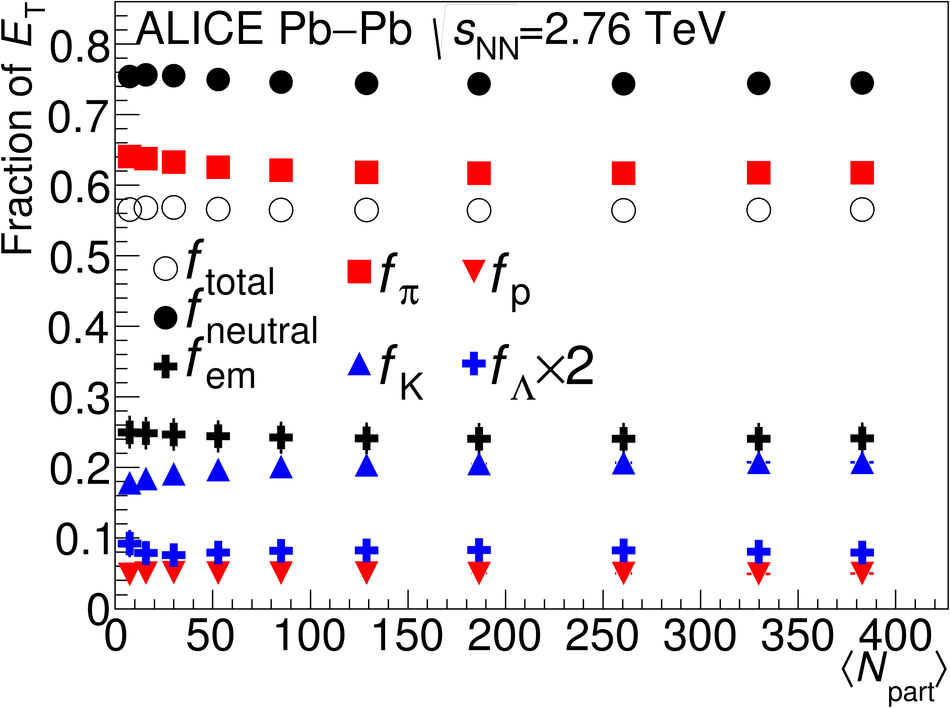 |
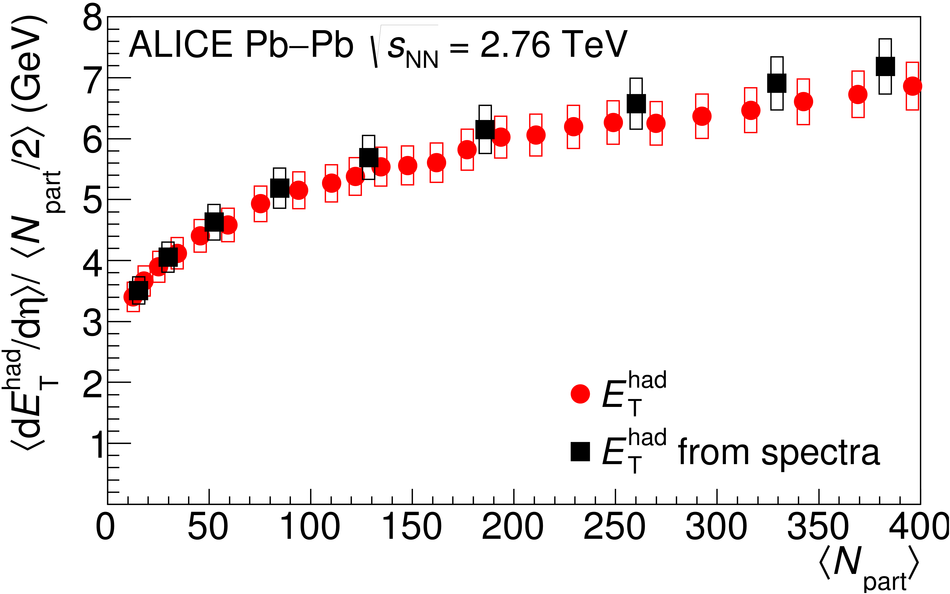
Figure 6
Comparison of $\langle $d$E_{\mathrm T}^{\mathrm{em}}/$d$\eta \rangle / \langle N_{\mathrm{part}}/2\rangle$ versus $\langle N_{\mathrm{part}}
\rangle$ at midrapidity from the PHOS, from the EMCal, and as calculated from the measured pion spectra. The boxes indicate the systematic uncertainties. | 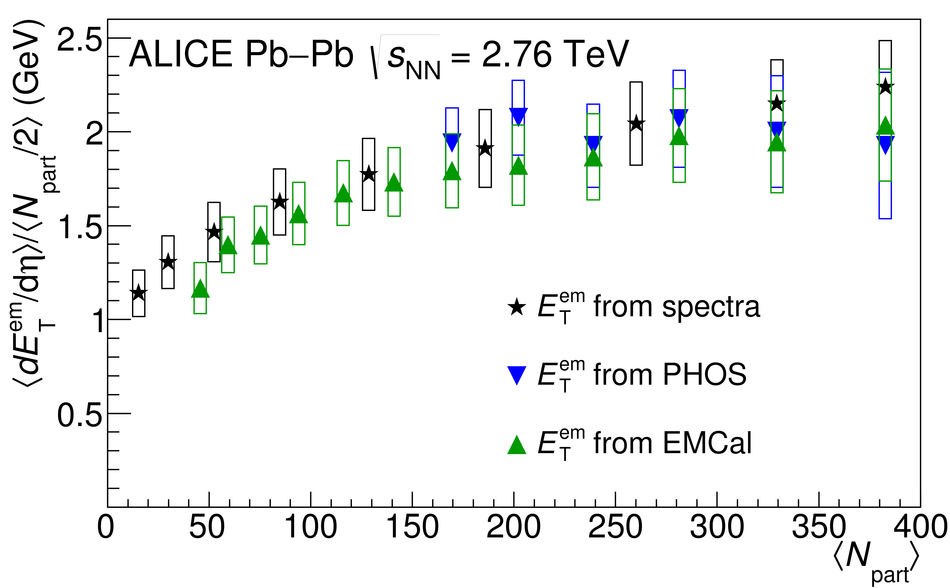 |
Figure 7
Comparison of total $\langle $d$E_{\mathrm T}/$d$\eta
\rangle / \langle N_{\mathrm{part}}/2
\rangle$ versus $\langle N_{\mathrm{part}}
\rangle$ at midrapidity using tracking detectors, using EMCal+tracking, using PHOS+tracking, and as calculated from the measured particle spectra. The boxes indicate the systematic uncertainties. | 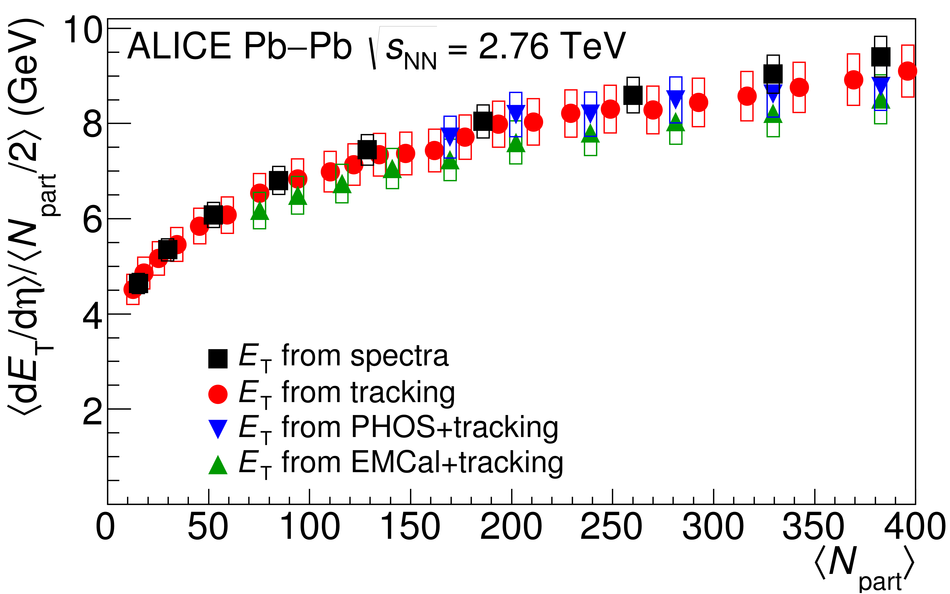 |
Figure 8
Comparison of $\langle $d$E_{\mathrm T}/$d$\eta \rangle / \langle N_{\mathrm{part}}/2\rangle$ at midrapidity in Pb-Pb collisions at ${\sqrt{s_{\mathrm {NN}}}}$ = 2.76 TeV from CMS and ALICE and in Au-Au collisions at ${\sqrt{s_{\mathrm {NN}}}}$ = 200 GeV from STAR and PHENIX. Data from RHIC were scaled by a factor of 2.7 for comparison of the shapes The boxes indicate the systematic uncertainties. | 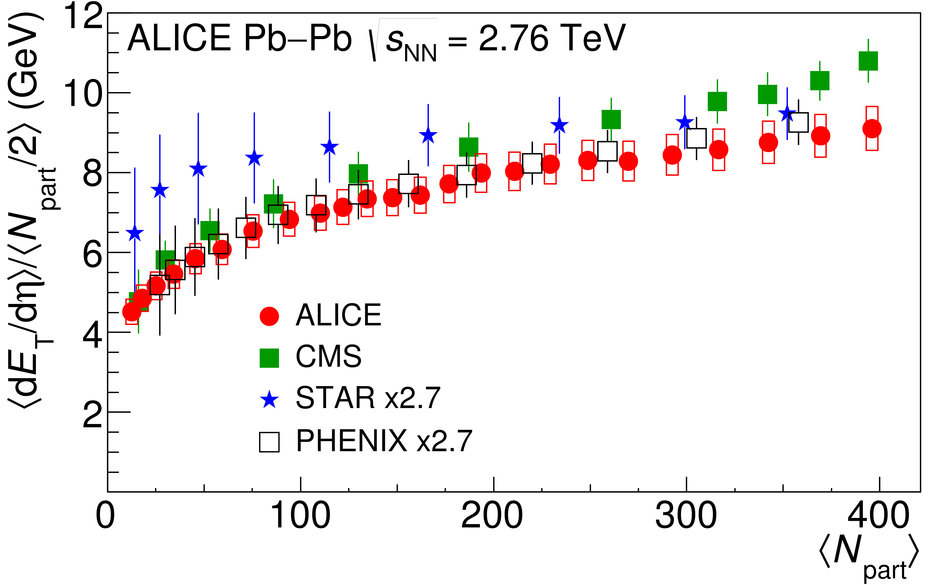 |
Figure 9
Measurements of $\langle $d$E_{\mathrm T}/$d$\eta
\rangle / \langle N_{\mathrm{quark}}/2
\rangle$ versus $\langle N_{\mathrm{part}}
\rangle$ at midrapidity in Pb-Pb collisions at ${\sqrt{s_{\mathrm {NN}}}}$ = 2.76 TeV. Note the suppressed zero. The boxes indicate the systematic uncertainties. | 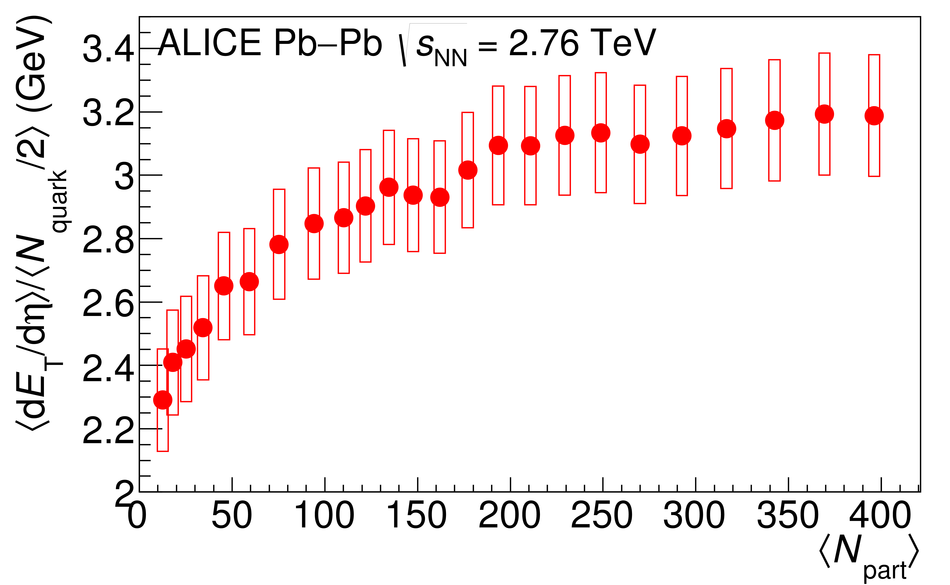 |
Figure 10
Comparison of $\langle $d$E_{\mathrm T}/$d$\eta
\rangle$/$\langle $d$N_{\mathrm{ch}}/$d$\eta
\rangle$ versus $\langle N_{\mathrm{part}}
\rangle$ at midrapidity in Pb-Pb collisions at ${\sqrt{s_{\mathrm {NN}}}}$ = 2.76 TeV from ALICE and in Au-Au collisions at ${\sqrt{s_{\mathrm {NN}}}}$ = 200 GeV from STAR and PHENIX. | 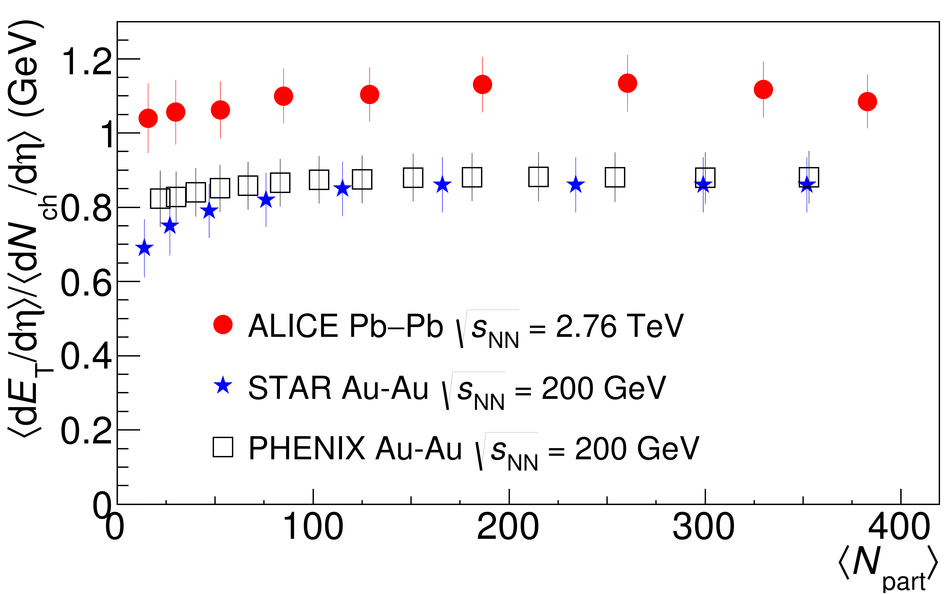 |
Figure 11
Comparison of $\langle $d$E_{\mathrm T}/$d$\eta
\rangle / \langle N_{\mathrm{part}}/2
\rangle$ at midrapidity versus ${\sqrt{s_{\mathrm {NN}}}}$ in 0-5% central Pb-Pb collisions at ${\sqrt{s_{\mathrm {NN}}}}$ = 2.76 TeV from ALICE and CMS and central collisions at other energies at midrapidity. All measurements are from 0-5% central collisions except the NA49 data, which are from 0-7% collisions. | 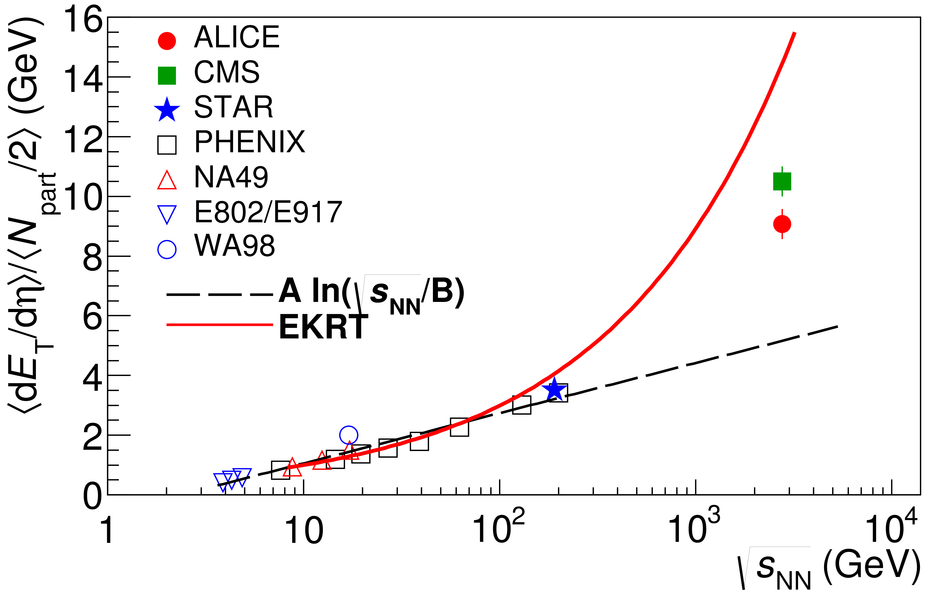 |
Figure 12
Comparison of $\langle $d$E_{\mathrm T}/$d$\eta
\rangle$/$\langle $d$N_{\mathrm{ch}}/$d$\eta
\rangle$ at midrapidity versus ${\sqrt{s_{\mathrm {NN}}}}$ in Pb-Pb collisions at ${\sqrt{s_{\mathrm {NN}}}}$ = 2.76 TeV from ALICE and measurements at other energies. The band shows the extrapolation from lower energies with the width representing the uncertainty on the fit. | 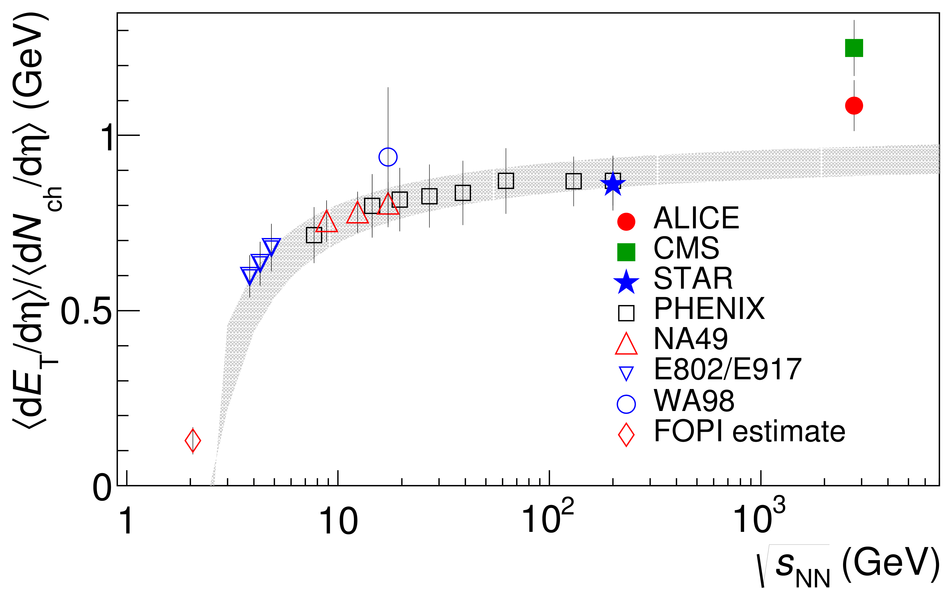 |