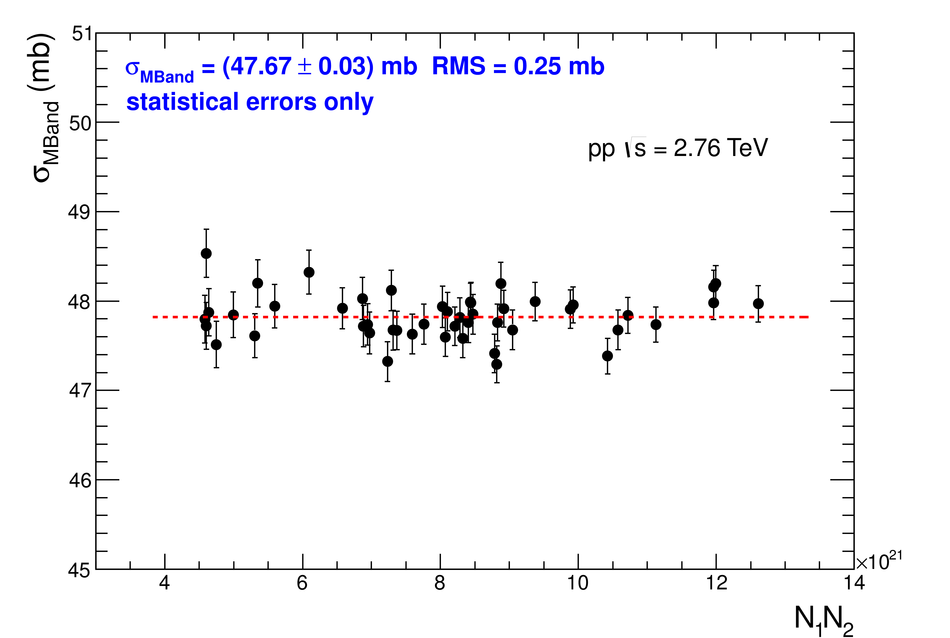
Top: MBand trigger rate vs. beam separation in $x$ and $y$ obtained during the May 2010 van der Meer scan. Double Gaussian fits to the data are shown as lines. Bottom: Measured MBand cross section for 48 colliding bunch pairs in the March 2011 scan, as a function of the product of colliding bunch intensities N$_1$N$_2$. | 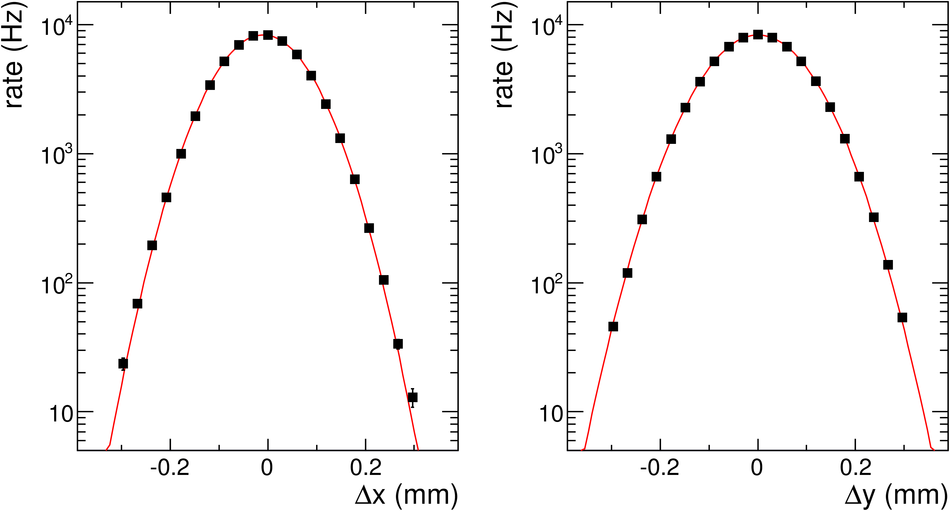 |