In two-particle angular correlation measurements, jets give rise to a near-side peak, formed by particles associated to a higher $p_{\mathrm{T}}$ trigger particle. Measurements of these correlations as a function of pseudorapidity ($\Delta\eta$) and azimuthal ($\Delta\varphi$) differences are used to extract the centrality and $p_{\mathrm{T}}$ dependence of the shape of the near-side peak in the $p_{\mathrm{T}}$ range $1 <~ p_{\mathrm{T}} <~$ 8 GeV/c in Pb-Pb and pp collisions at $\sqrt{s_{\mathrm{NN}}}$ = 2.76 TeV. A combined fit of the near-side peak and long-range correlations is applied to the data and the peak shape is quantified by the variance of the distributions. While the width of the peak in the $\Delta\varphi$ direction is almost independent of centrality, a significant broadening in the $\Delta\eta$ direction is found from peripheral to central collisions. This feature is prominent for the low $p_{\mathrm{T}}$ region and vanishes above 4 GeV/c. The widths measured in peripheral collisions are equal to those in pp in the $\Delta\varphi$ direction and above 3 GeV/c in the $\Delta\eta$ direction. Furthermore, for the 10\% most central collisions and $1 <~ p_{\mathrm{T, assoc}} <~$ 2 GeV/c, $1 <~ p_{\mathrm{T, trig}} <~$ 3 GeV/c a departure from a Gaussian shape is found: a depletion develops around the centre of the peak. The results are compared to AMPT model simulations as well as other theoretical calculations indicating that the broadening and the development of the depletion is connected to the strength of radial and longitudinal flow.
Phys. Rev. C 96 (2017) 034904
HEP Data
e-Print: arXiv:1609.06667 | PDF | inSPIRE
CERN-EP-2016-228
Figure 1
Illustration of the fitting procedure for the 10\% most central Pb--Pb events at \snn\ = \unit[2.76]{TeV} in $2< \pta< $ \unit[3]{\gevc} and $3< \ptt< $ \unit[4]{\gevc}. The panels show \protect\subref{subfig:fit1} the two-dimensional azimuthal and pseudorapidity total per-trigger yield, \protect\subref{subfig:fit2} the background distribution and \protect\subref{subfig:fit3} the signal peak component from the fit by Eq. \ref{eq:fit}, and \protect\subref{subfig:fit4} the relative difference between the data and the fit. |  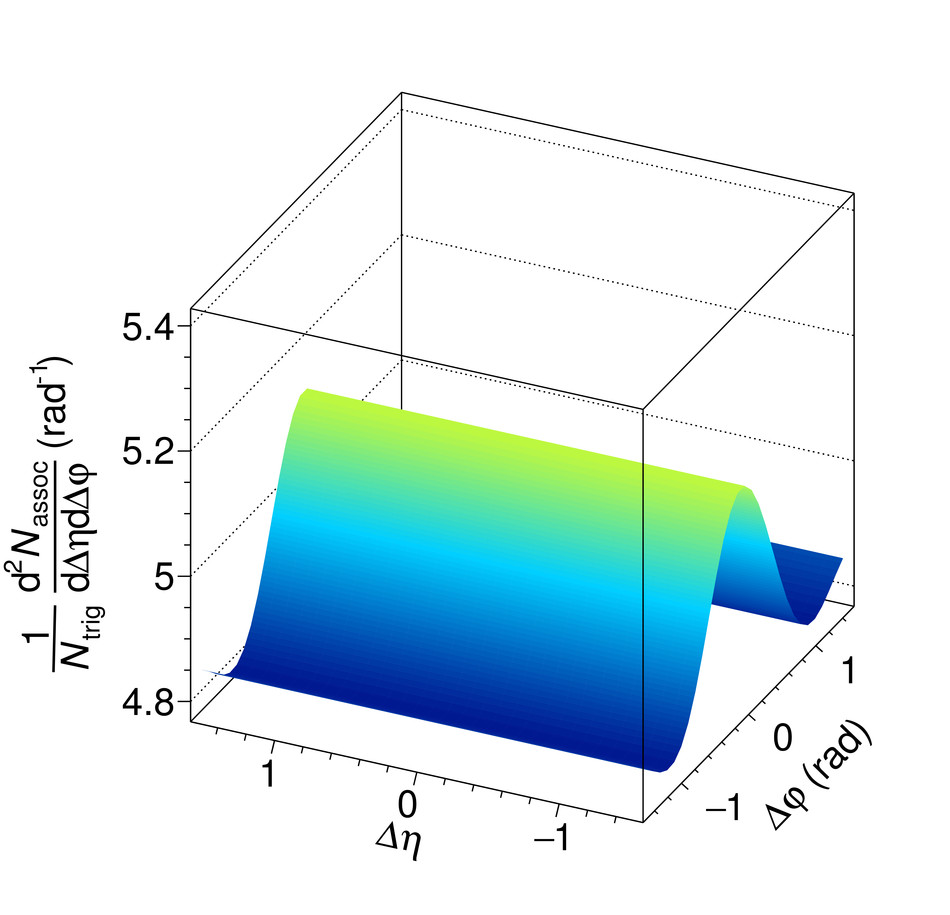 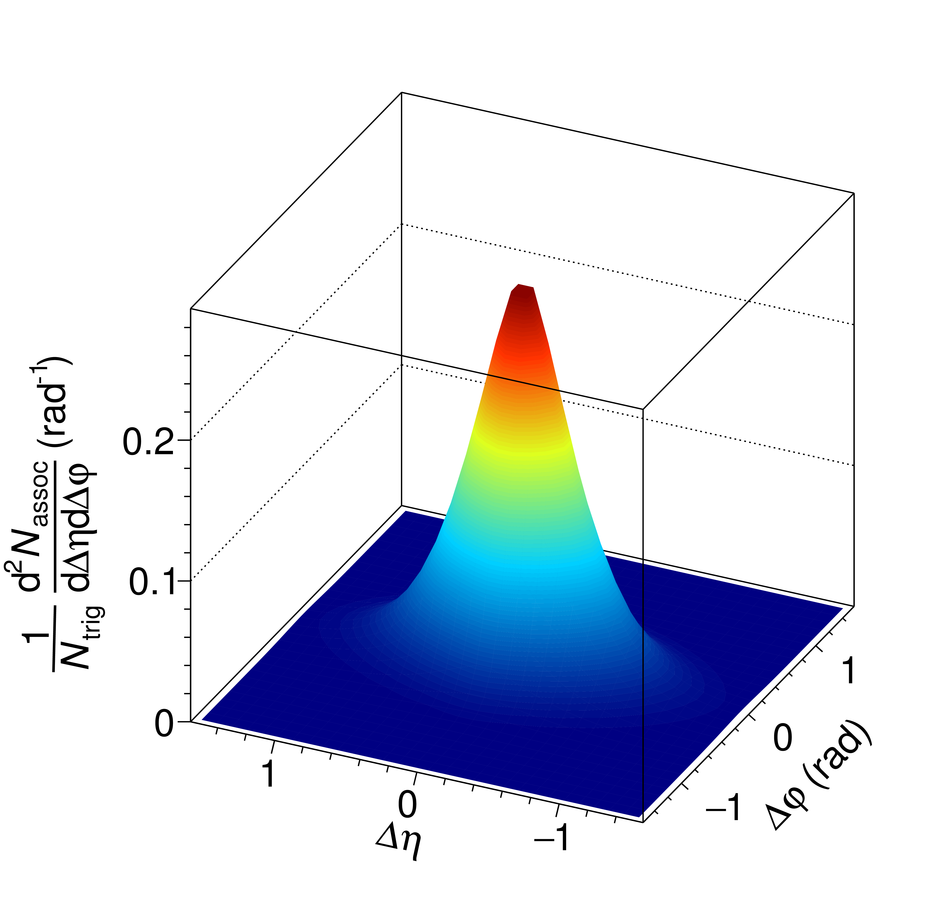 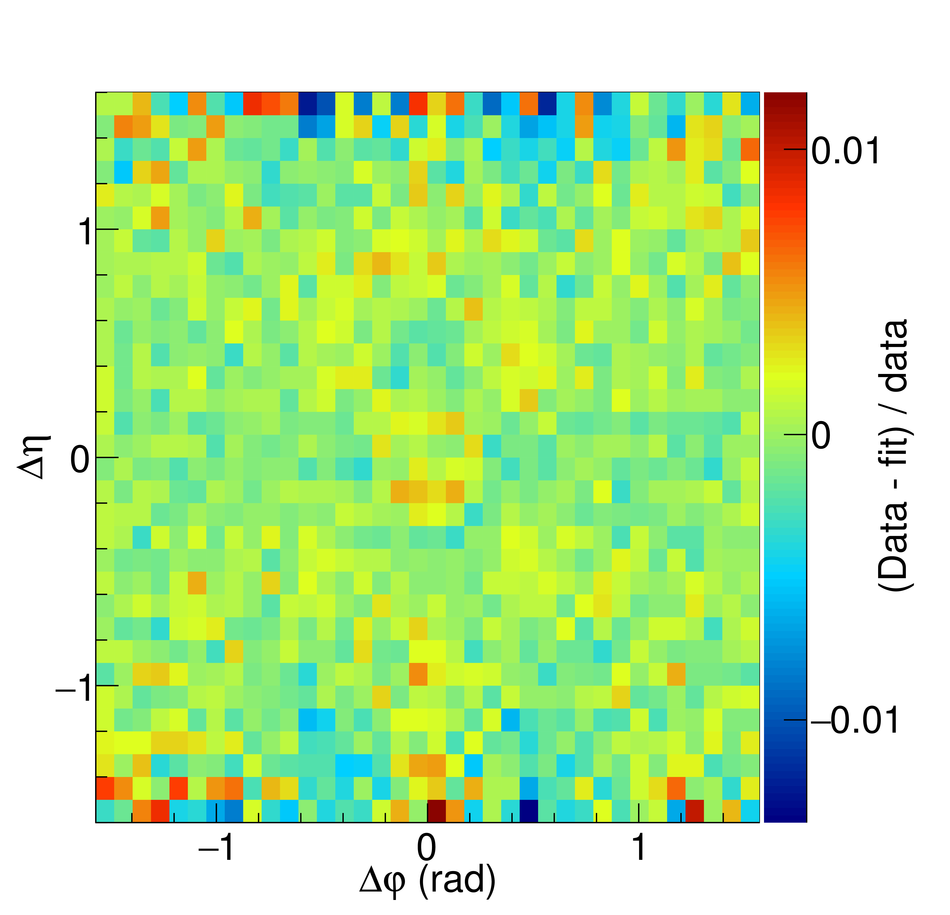 |
Figure 2
Projections of Fig. \ref{fig:fitexample} \subref{subfig:fit1} to the $\Dphi$ \protect\subref{subfig:results2c_projPhi} and $\Deta$ \protect\subref{subfig:results2c_projEta} directions. The projections integrated over $|\Deta| < 1.6$ and $|\Dphi| < \pi/2$, respectively, present per-trigger yields (and not densities) and therefore the level of the background is different than in Fig. \ref{fig:fitexample}. The fit and the background component of the fit are overlaid with the data. | 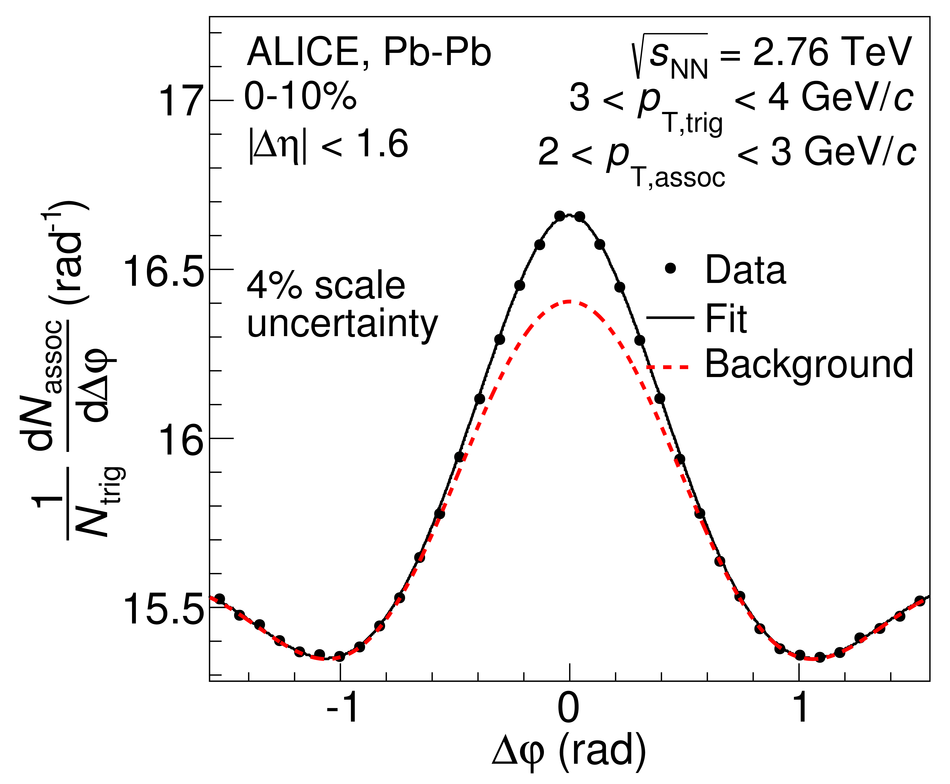 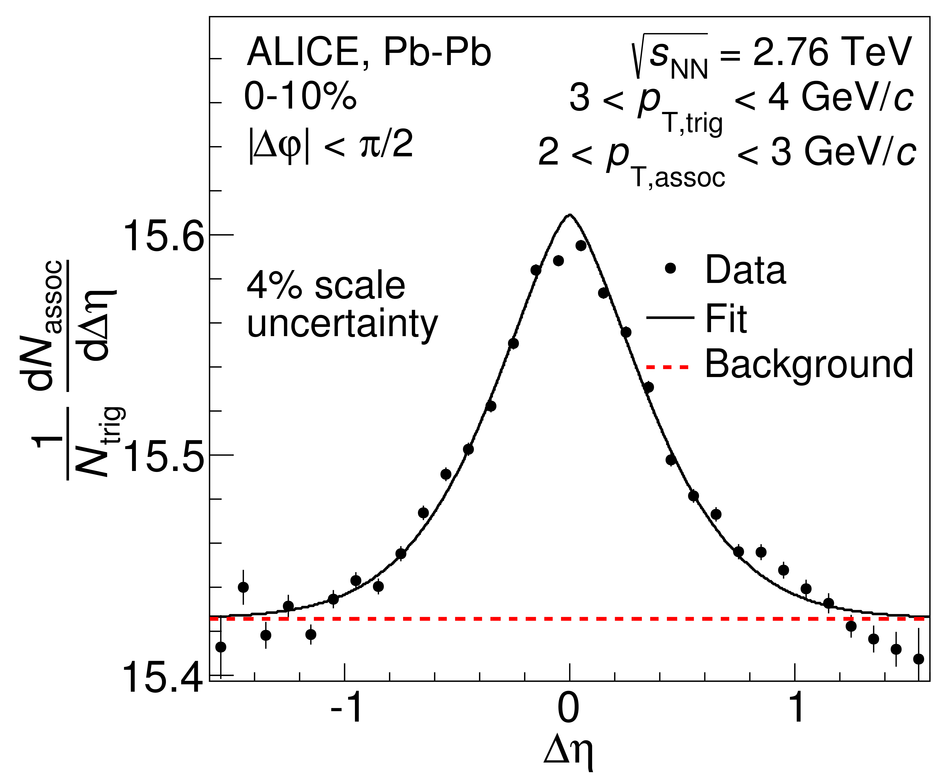 |
Figure 3
Associated yield per trigger particle as a function of $\Dphi$ and $\Deta$ in pp collisions (left panels) and \mbox{Pb--Pb} collisions at \snn\ = \unit[2.76]{TeV} in the 50--80\% centrality class (middle panels) and in the 0--10\% centrality class (right panels). The top row shows $1< \pta< $ \unit[2]{\gevc} and $1< \ptt< $ \unit[2]{\gevc} and the bottom row shows $2< \pta< $ \unit[3]{\gevc} and $3< \ptt< $ \unit[4]{\gevc}. The background obtained from the fit function has been subtracted in order to emphasize the near-side peak | 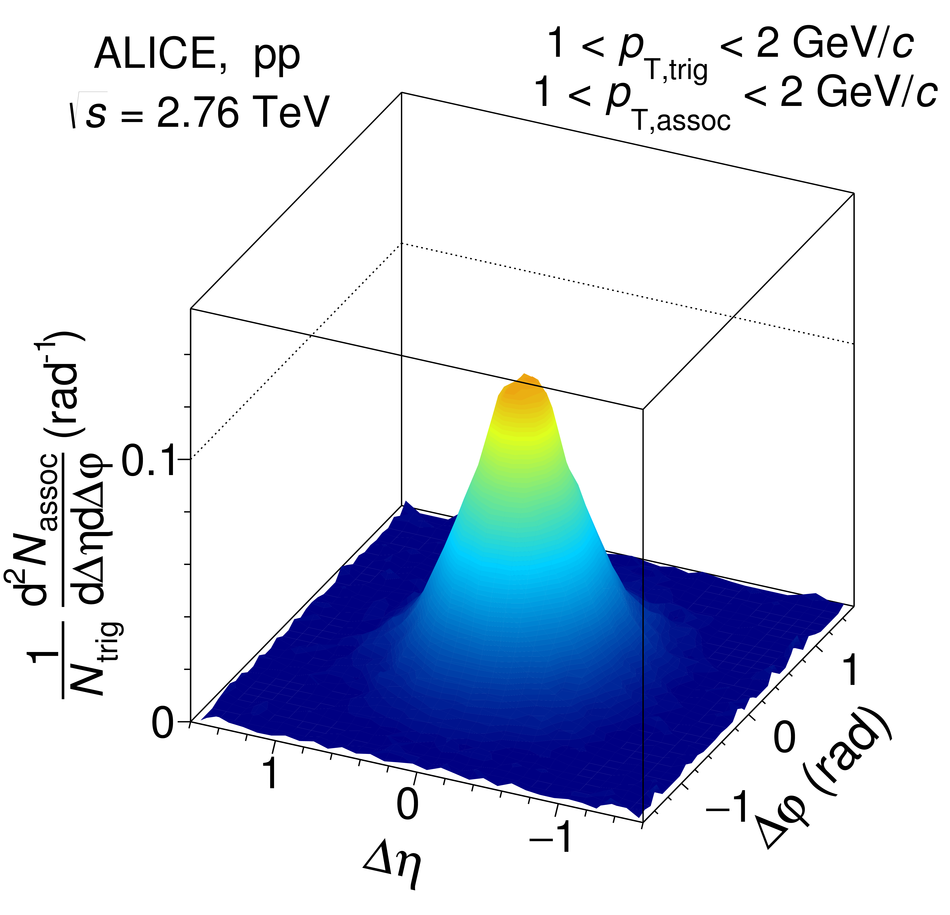 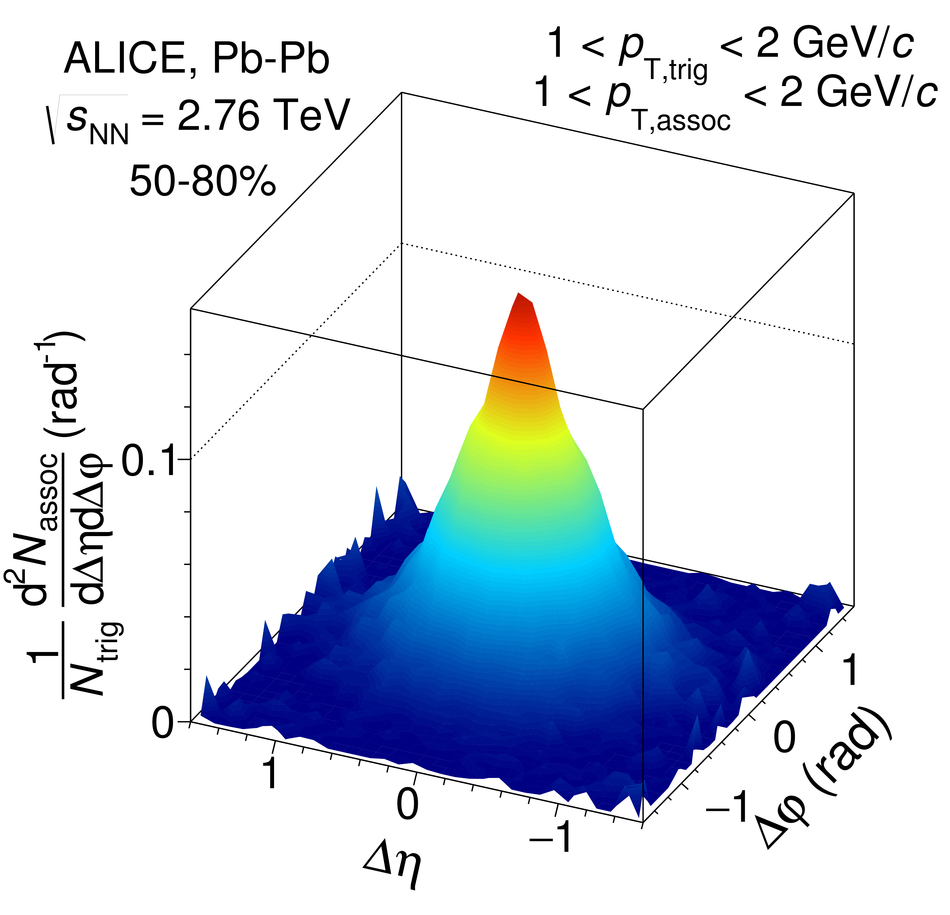 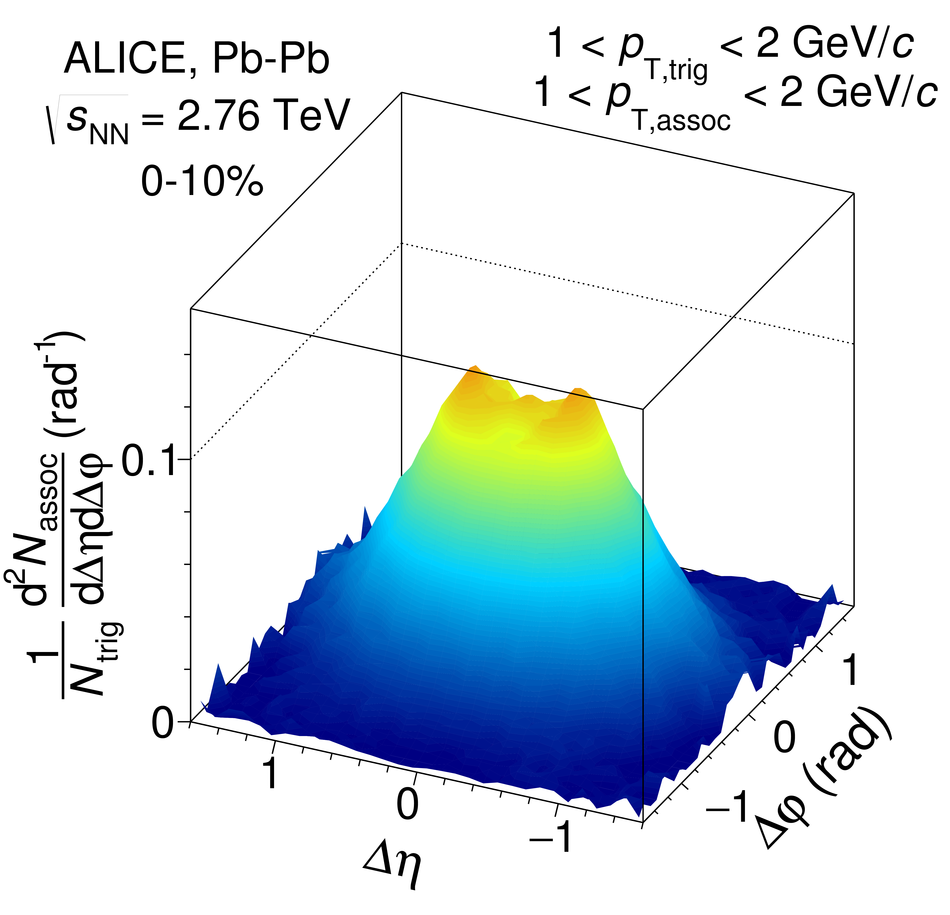 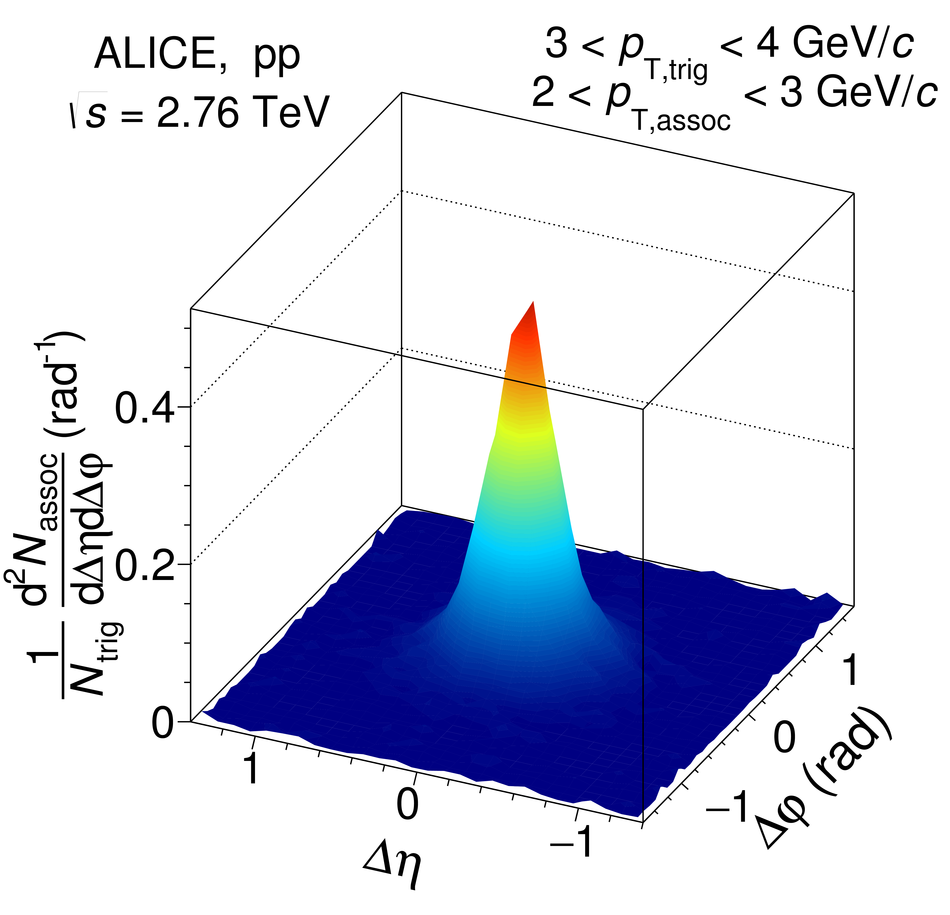 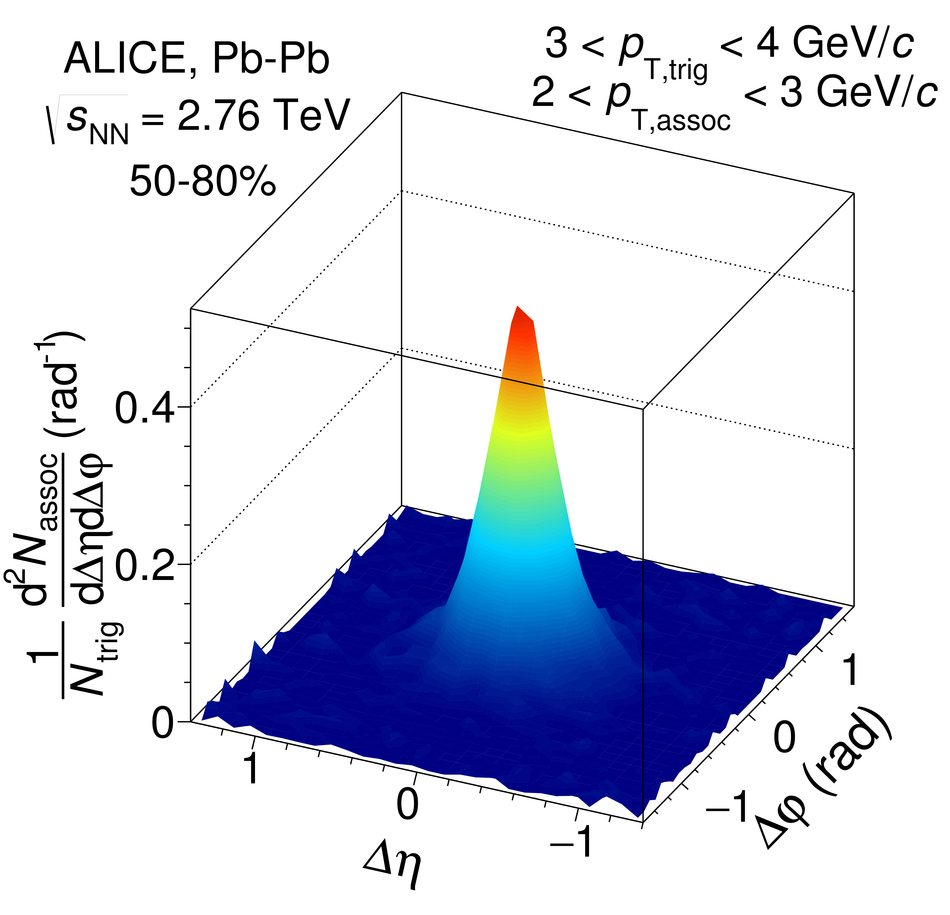 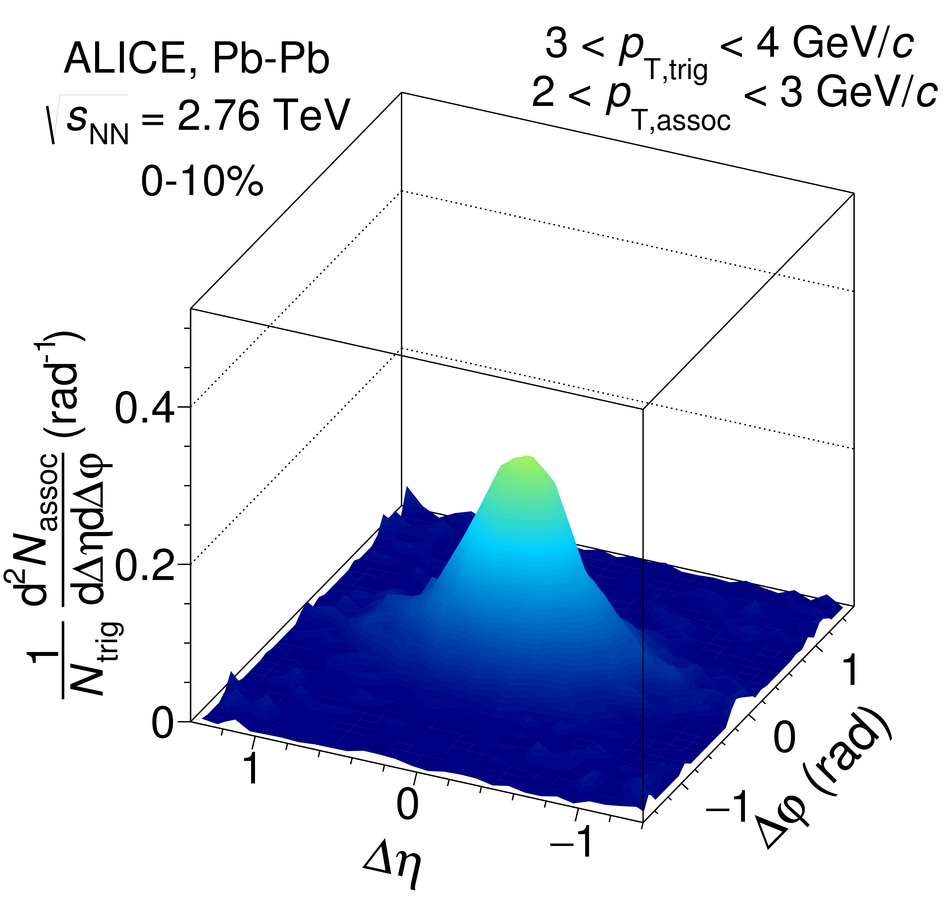 |
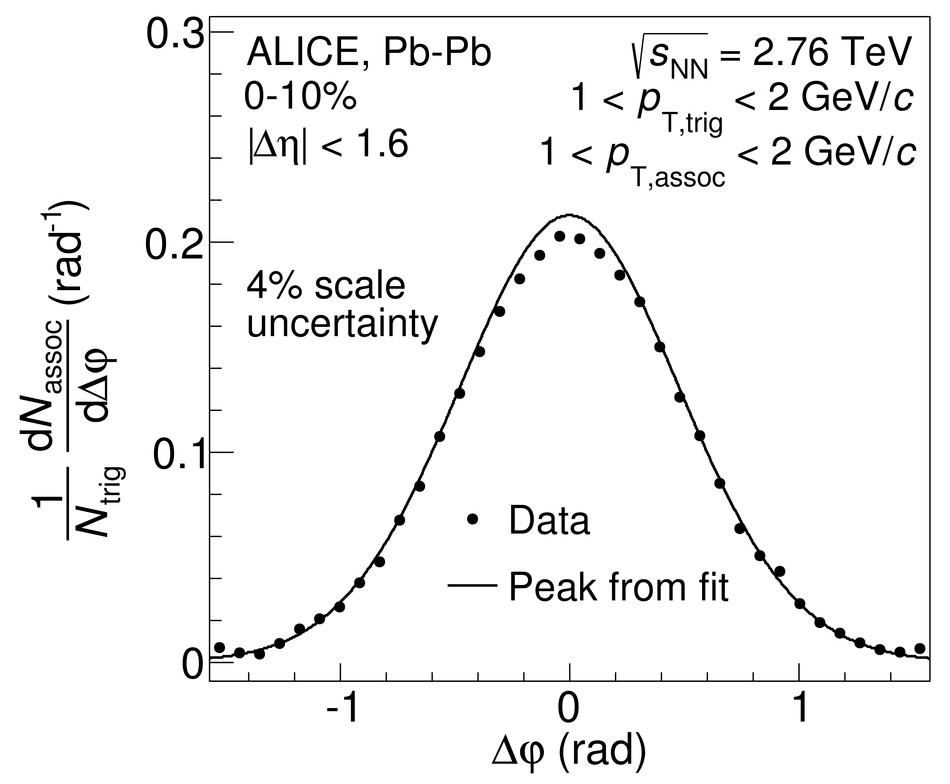
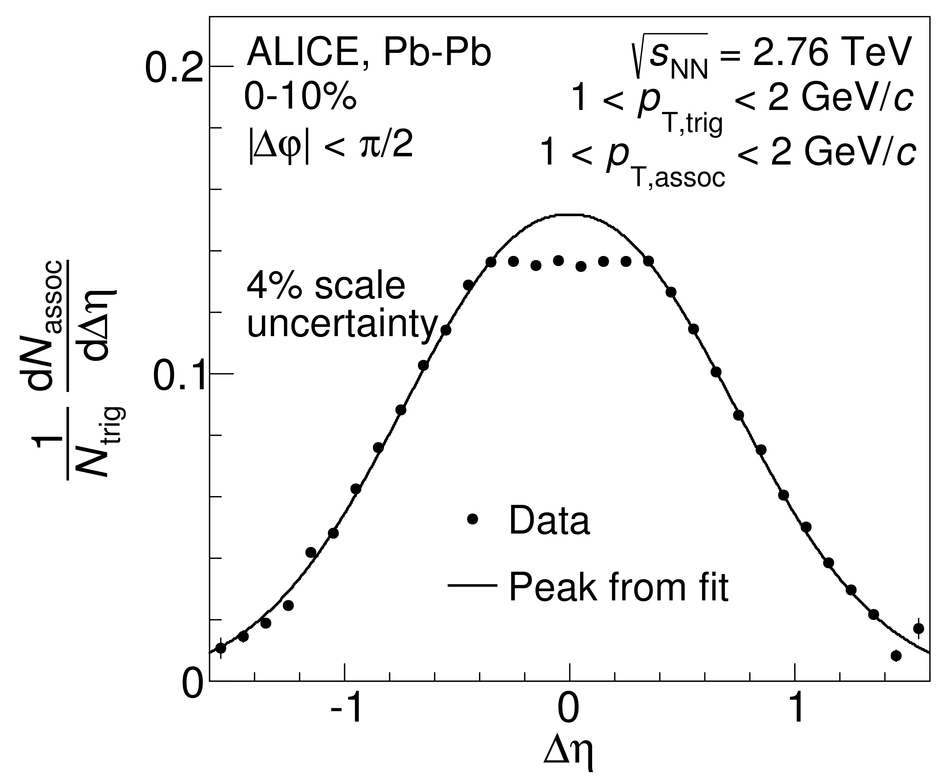
Figure 5
Shape parameters $\sigma_{\Dphi}$ (left panel) and $\sigma_{\Deta}$ (right panel) as a function of centrality in different $\pt$ ranges for Pb--Pb collisions at \snn\ = \unit[2.76]{TeV} and pp collisions (right most points in each panel). Lines indicate statistical uncertainties (mostly smaller than the marker size), while boxes denote systematic uncertainties. The markers are placed at the centre of the centrality bins | 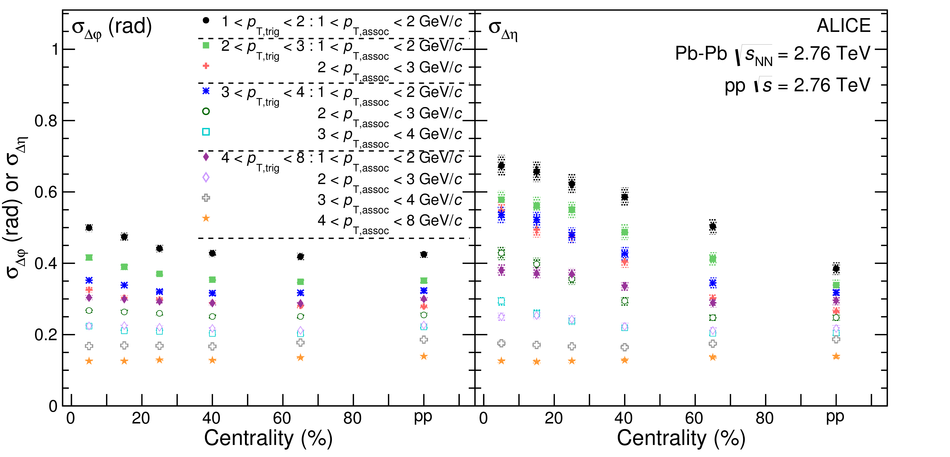 |
Figure 6
Ratio of the peak widths in $\Dphi$ (left panel) and $\Deta$ (right panel) observed in central (0--10\%) and peripheral (50--80\%) collisions as a function of $\pt _{\rm ,trig}$ and $\pt _{\rm ,assoc}$ ranges. The data is compared to the different AMPT settings. Note that the $x$-axis combines the $\pta$ and $\ptt$ axis, and therefore, a uniform trend of the values is not expected. Lines indicate statistical uncertainties (mostly smaller than the marker size), while boxes (only for data) denote systematic uncertainties |  |
Figure 7
Ratio of the peak widths in Pb--Pb collisions to AMPT in central collisions (top panels) and peripheral collisions (centre panels) as well as in pp collisions to PYTHIA (bottom panels). Panel \protect\subref{subfig:absolute_ratio1a} show the shape parameters $\sigma_{\Dphi}$ while panel \protect\subref{subfig:absolute_ratio1b} show $\sigma_{\Deta}$. Lines indicate statistical uncertainties (mostly smaller than the marker size), while boxes denote systematic uncertainties | 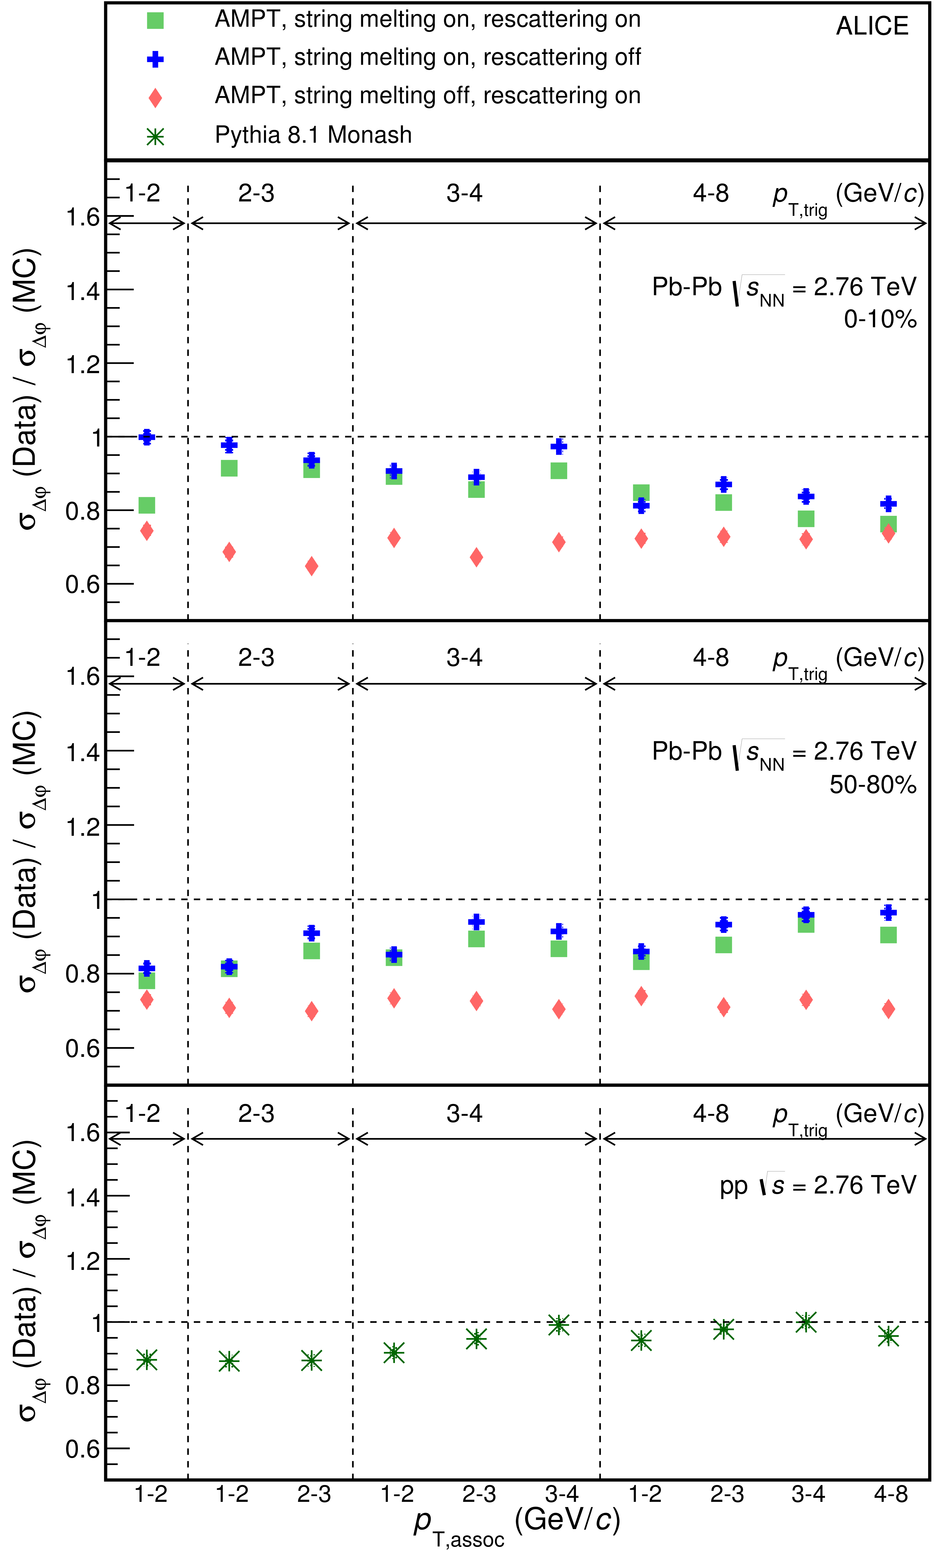 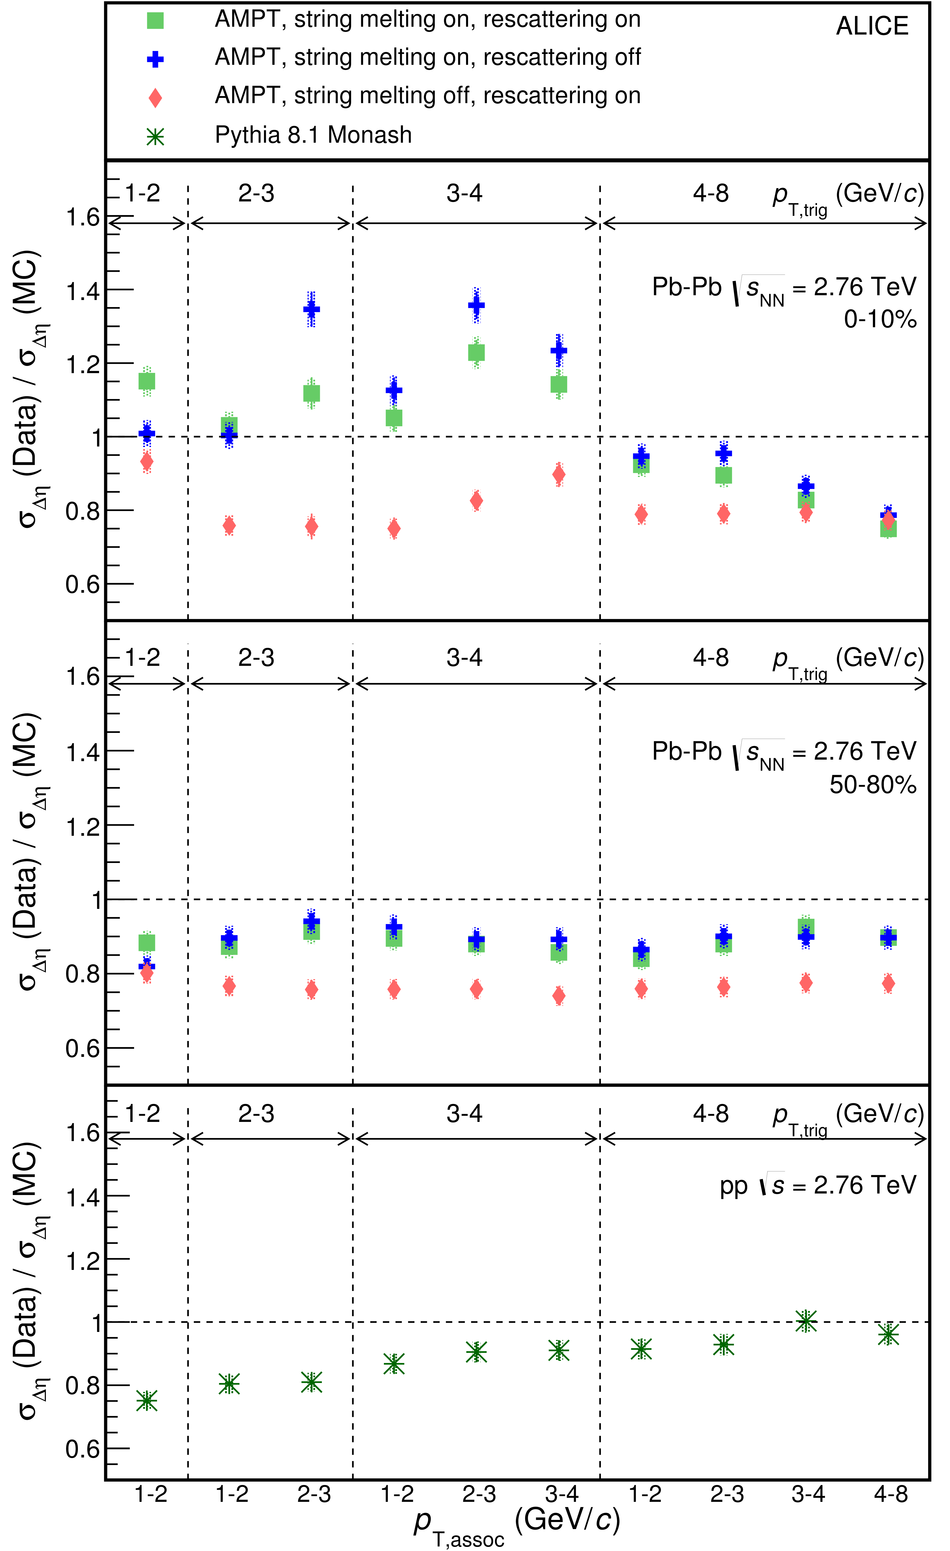 |
Figure 8
Upper row: associated yield per trigger particle as a function of $\Dphi$ and $\Deta$ in AMPT (generator level) for the 10\% most central events. Lower row: projections to the $\Dphi$ and $\Deta$ axis. The bin shown is $1< \ptt< $ \unit[2]{\gevc} and $1< \pta< $ \unit[2]{\gevc}. Three different AMPT settings are shown. Left panels: string melting and hadronic rescattering active; middle panels: only string melting active; right panels: only hadronic rescattering active. As in Fig. \ref{fig:pertriggeryields}, the combinatorial and flow background has been subtracted using the fit function. |  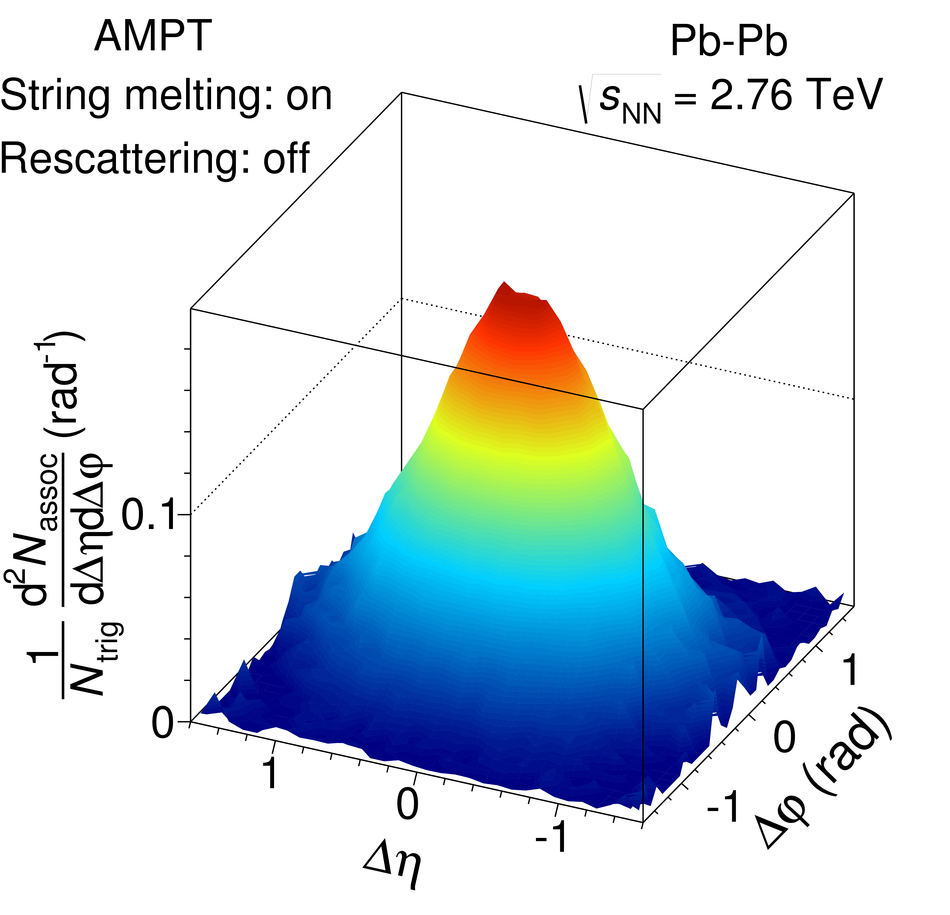 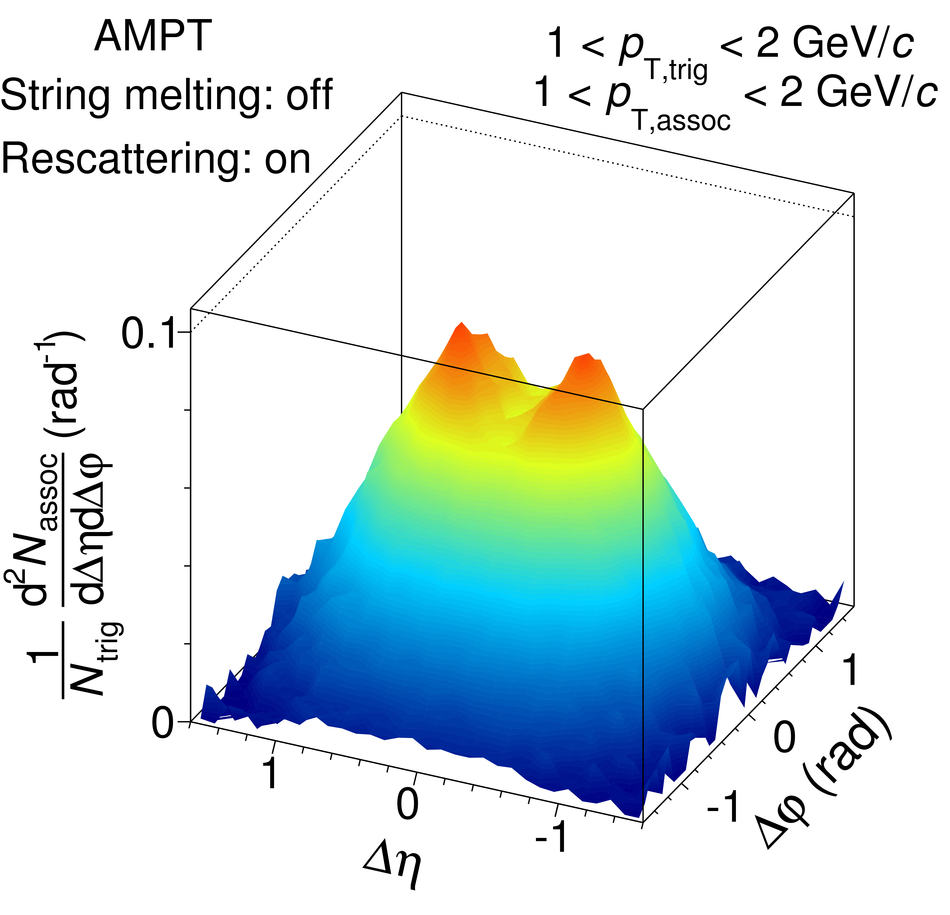 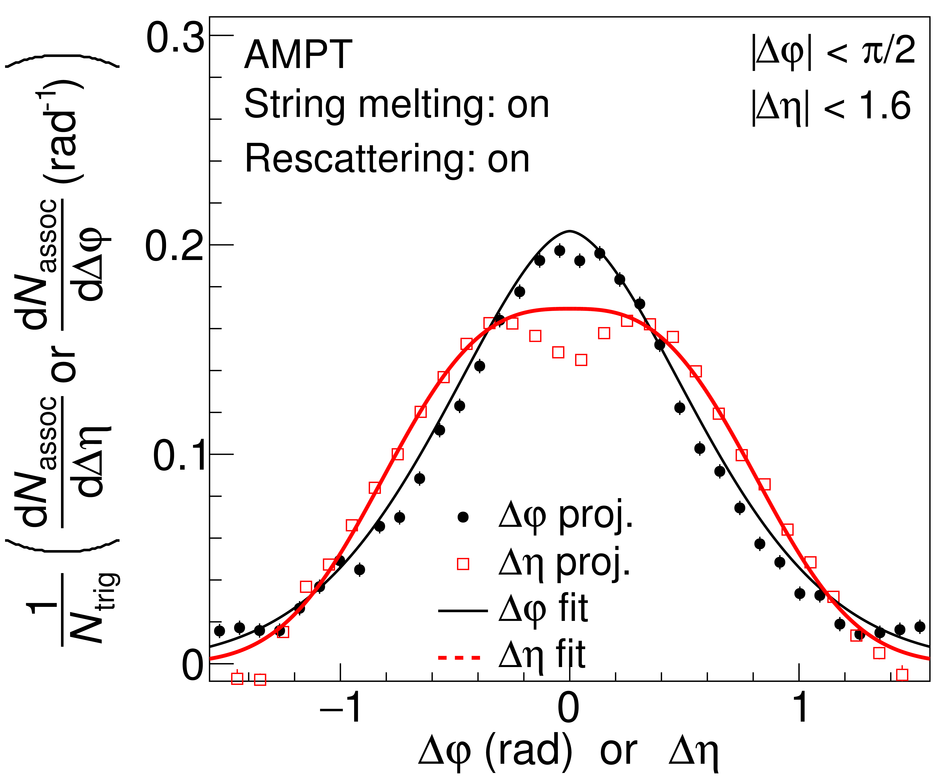 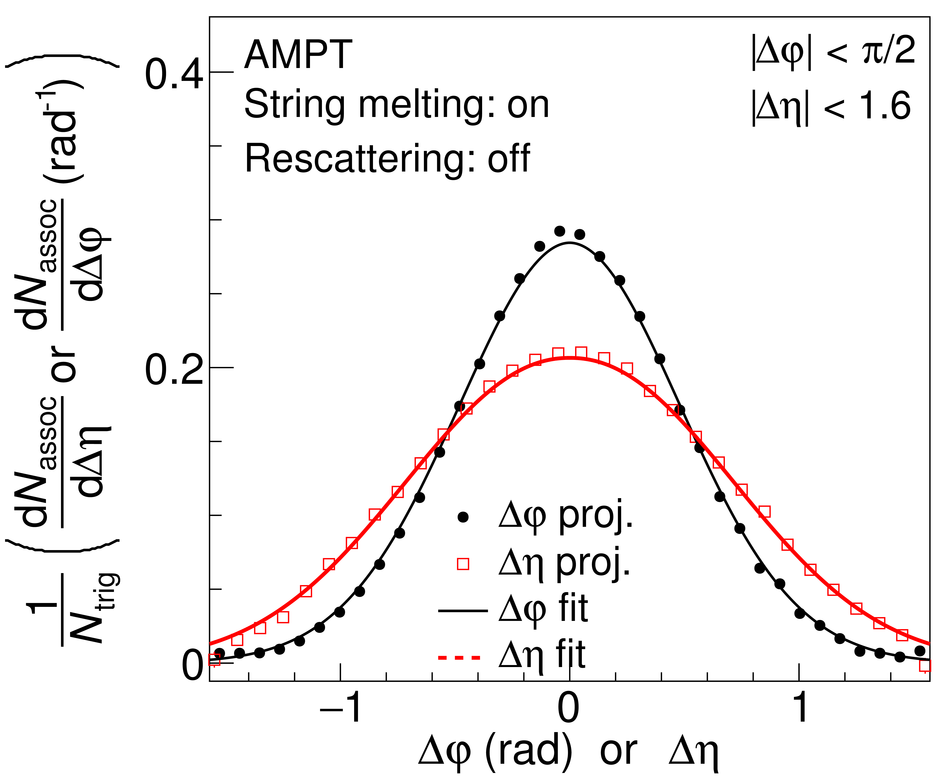 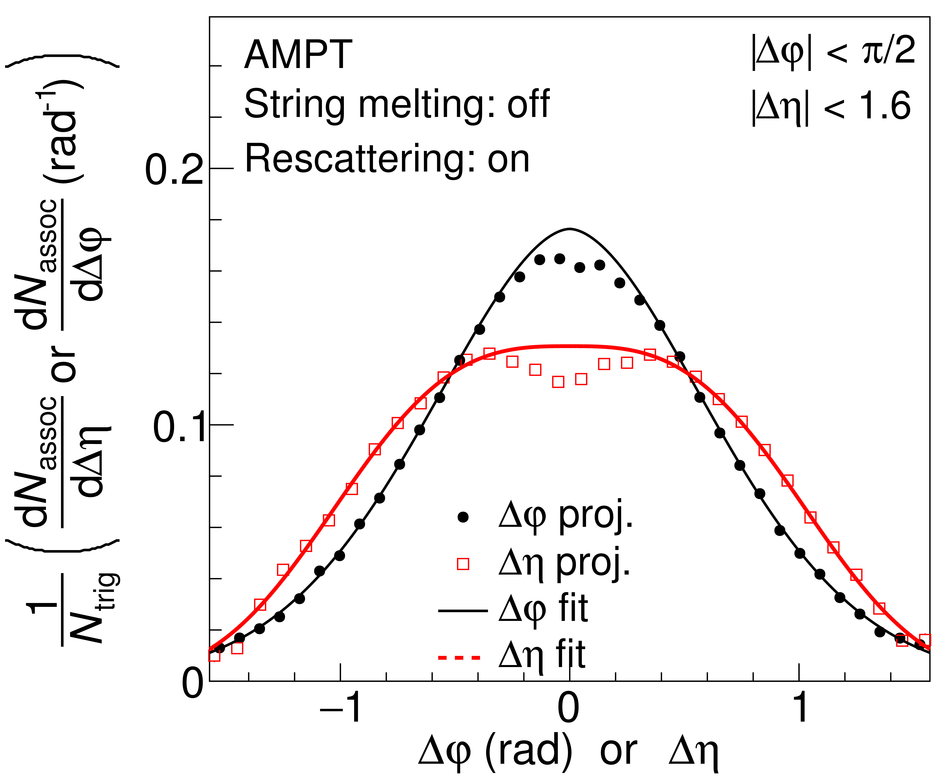 |
Figure 9
Missing yield in the depletion region relative to the overall peak yield extracted from the fit. Lines indicate statistical uncertainties (mostly smaller than the marker size), while boxes (only for data) denote systematic uncertainties. The arrows indicate the upper limit in case the uncertainty bands touch 0. The markers are placed at the centre of the centrality bins. For comparison, the non-zero values from two AMPT simulations are shown as lines. | 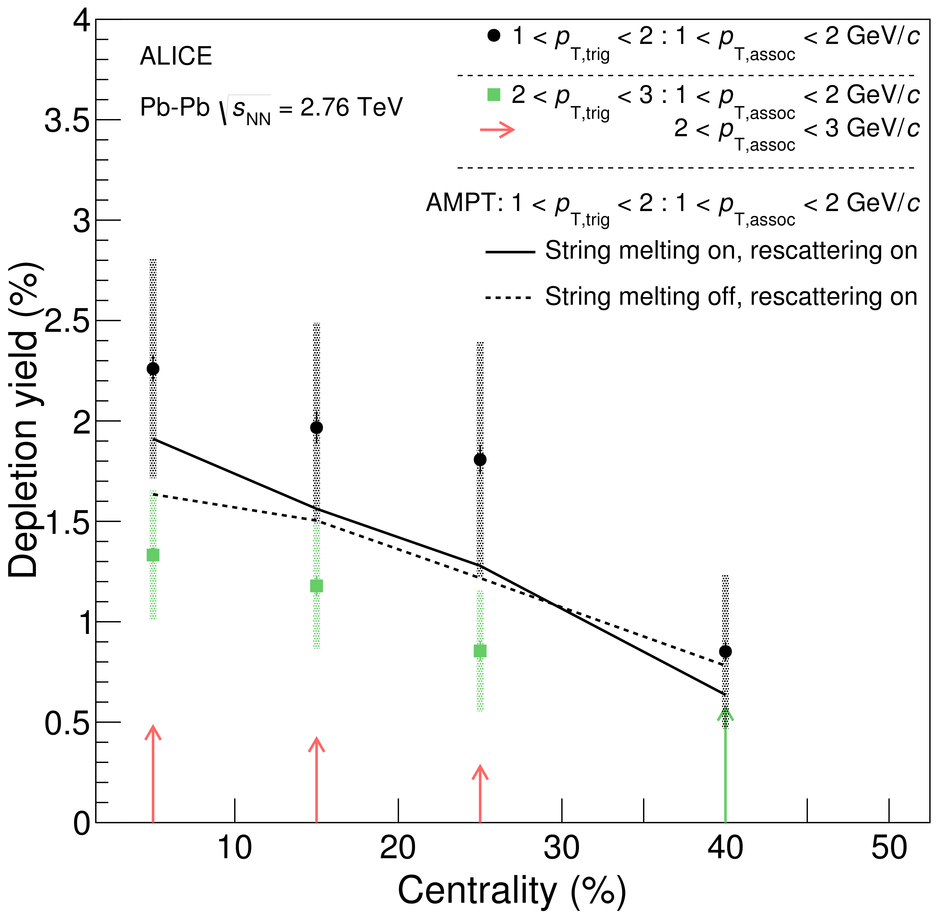 |
Figure 10
Comparison of the shape parameters $\sigma_{\Dphi}$ (left panel) and $\sigma_{\Deta}$ (right panel) to results from the STAR collaboration in Au--Au collisions at $\snn = \unit[200]{GeV}$ The markers are placed at the centre of the $p_{\rm T,assoc}$ bins, slightly displaced for visibility, and the uncertainties are statistical and systematic ones added in quadrature | 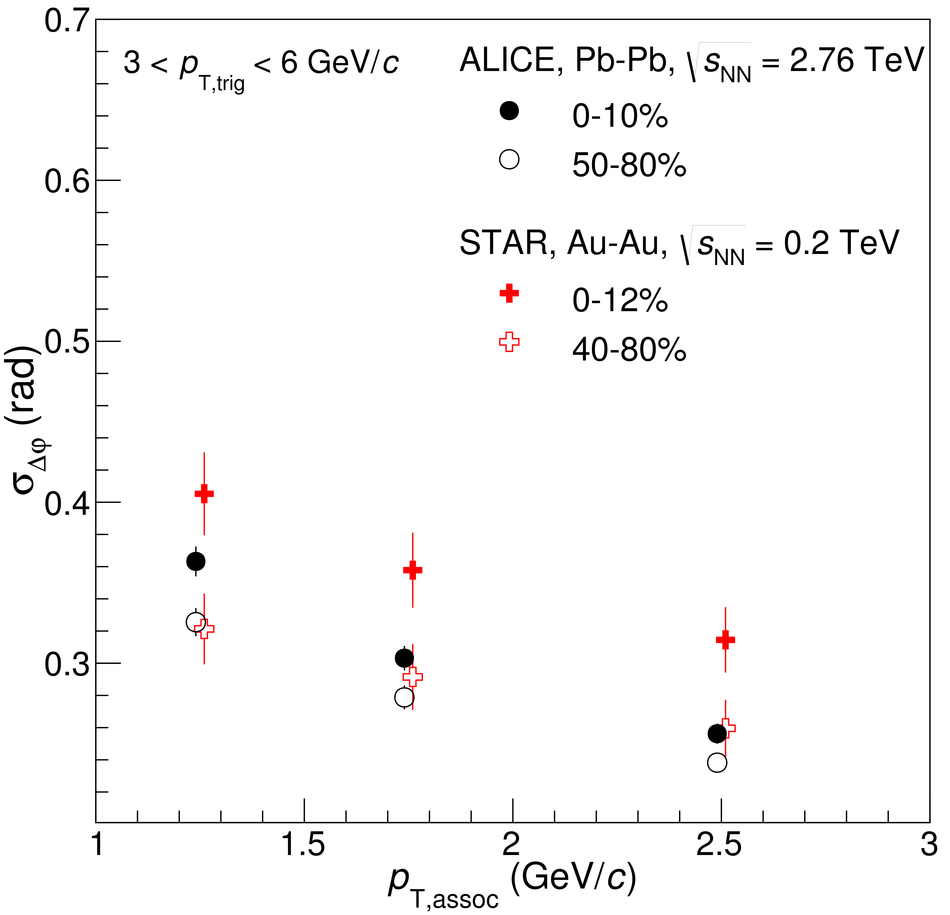  |