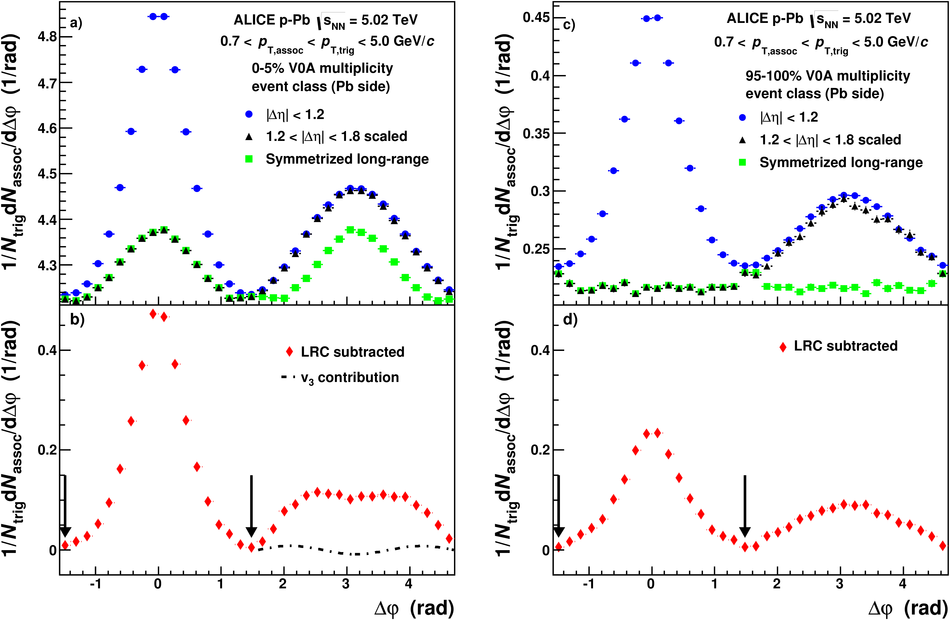
Per-trigger yield as a function of $\Dphi$ with $0.7< p_{\rm T,assoc} < p_{\rm T,trig} < $ 5 GeV/$c$ in the 0-5% event class (left) and 95-100% event class (right). The distributions show the correlations before subtraction (blue circles), the long-range correlations (black triangles) scaled according to the $\Deta$ region in which they are integrated, the symmetrized near-side long-range correlations (green squares) and the correlations after long-range correlations (LRC) subtraction (red diamonds). The vertical arrows indicate the integration regions while the curve in the bottom left panel shows the magnitude of the third Fourier component on the away side. Statistical uncertainties are shown but are smaller than the symbol size |  |