$Q_{\rm pPb}$ spectra (points) of all primary charged particles for various centrality classes obtained with the different centrality estimators explained in the text. The lines are from G-PYTHIA calculations The systematic error on the spectra is only shown for the V0A 0-5% centrality bin and is the same for all others. The systematic uncertainty on pp and p-Pb normalization is shown as a gray box around unity at $\pt$ =0. The systematic uncertainty on $\langle T_{\rm pPb} \rangle_{\rm MB}$ is shown as a light blue box around unity at high $\pt$. | 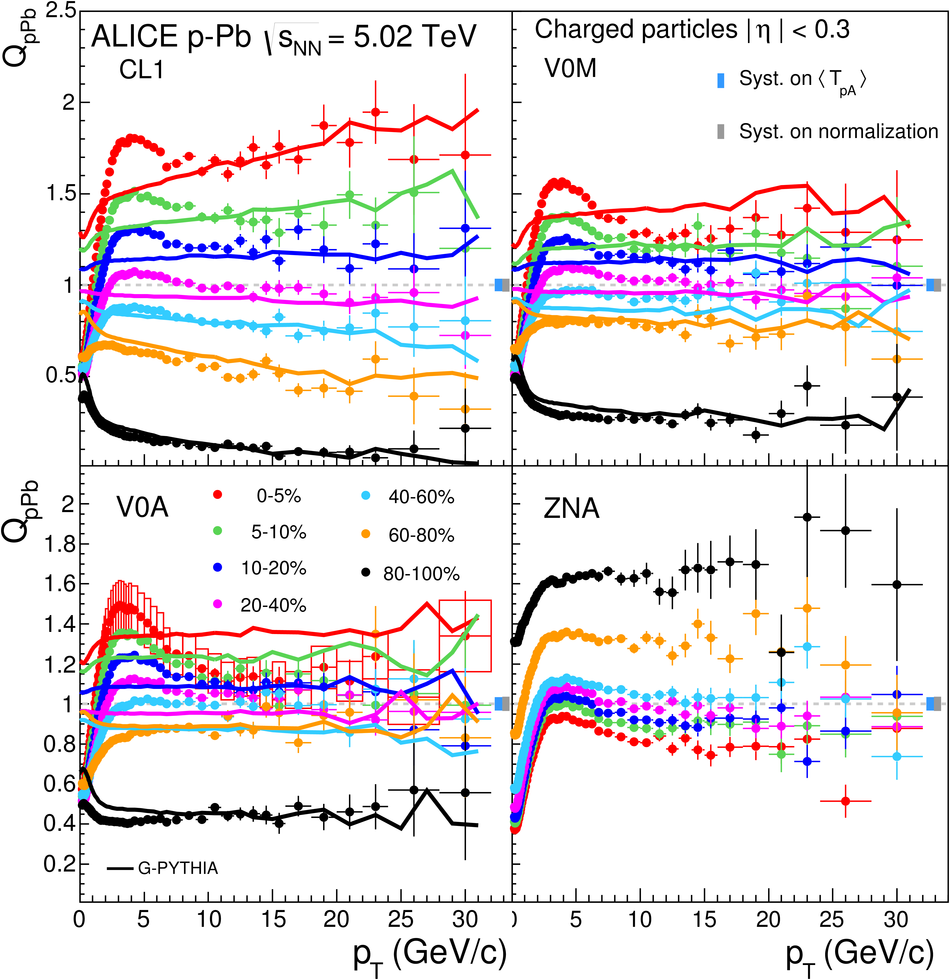 |