The azimuthal correlation between heavy-flavour decay electrons and charged hadrons, scaled by the number of electrons is shown for (a) the MB events in the $p^{\mathrm{e}}_{\mathrm{T}}$ range 1.5 to 2.5 GeV/$c$ and (b) the EMCal events in the $p^{\mathrm{e}}_{\mathrm{T}}$ range 4.5 to 6.0 GeV/$c$. The diamonds represent the MC distribution for electrons from charm hadron decays, squares are the MC distribution for electrons from beauty hadron decays. The line is the MC fit (Eq. \ref{eq:fit}) to the data points (circles). | 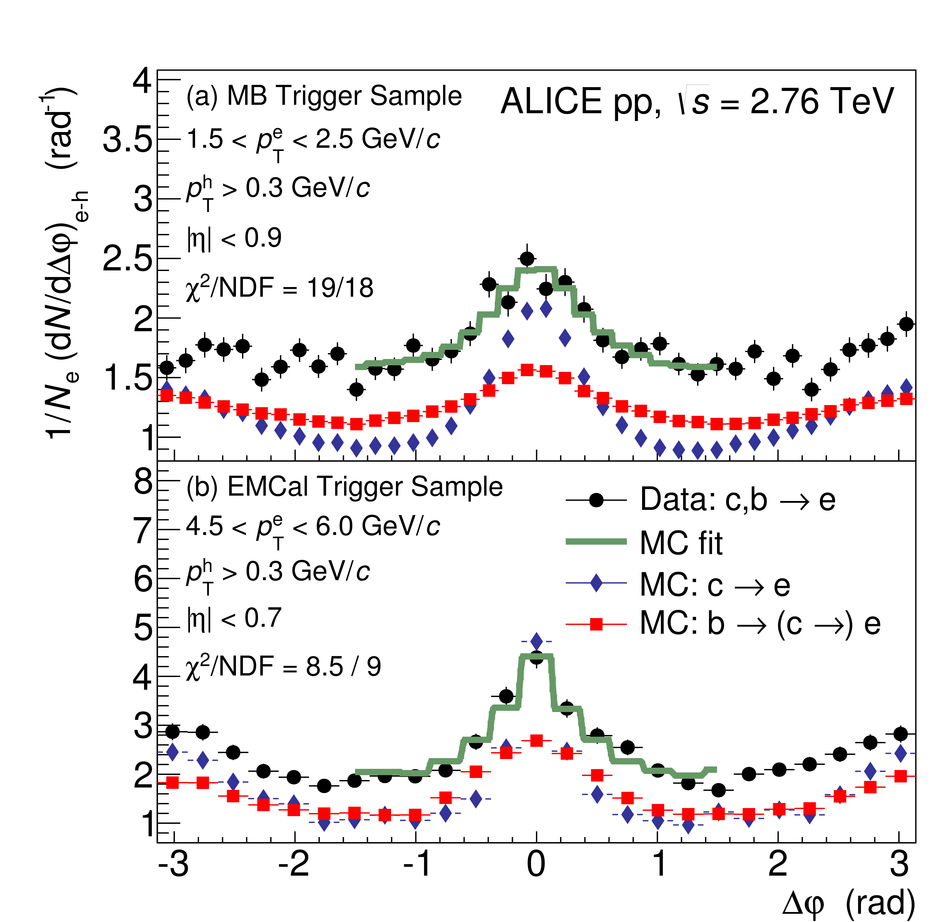 |