The $d-\overline{d}$ (top) and $^3{\rm He}-^3\overline{\rm He}$ (bottom) mass-over-charge ratio difference measurements as a function of the particle rigidity. Vertical bars and open boxes show the statistical and the uncorrelated systematic uncertainties (standard deviations), respectively. Both are taken into account to extract the combined result in the full rigidity range, together with the correlated systematic uncertainty, which is shown as a box with tilted lines. Also shown are the $1\sigma$ and $2\sigma$ bands around the central value, where $\sigma$ is the sum in quadrature of the statistical and systematic uncertainties. | 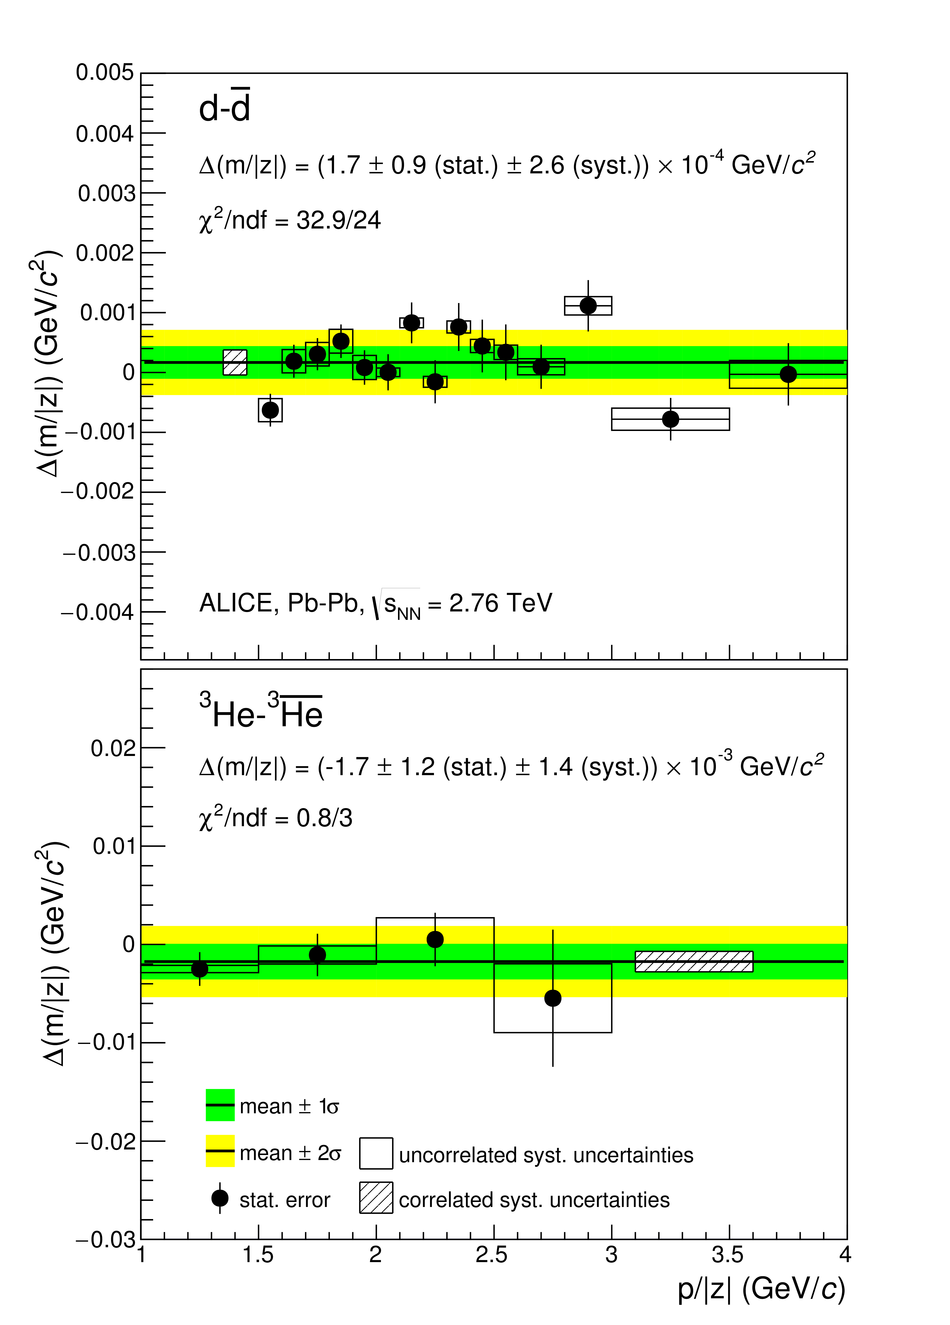 |