Comparison of $p_{\rm{T}}$ spectra of $\pi$, K and p (sum of particles and antiparticles) measured by the ALICE ($|y|< 0.5$) and CMS Collaborations ($|y|< 1$) in pp collisions at $\sqrt{s}$ = 7 TeV. The CMS data points are scaled by the empirical factor 0.78, as described in . Inset plot: Ratios between ALICE and CMS data in the common $p_{\rm{T}}$ range. The combined ALICE and CMS statistical (vertical error bars) and systematic (open boxes) uncertainties are reported. The combined ALICE ($ ^{+7}_{-4} \%$) and CMS ($\pm 3\%$) normalization uncertainty is shown as a grey box around 1 and not included in the point-to-point uncertainties. | 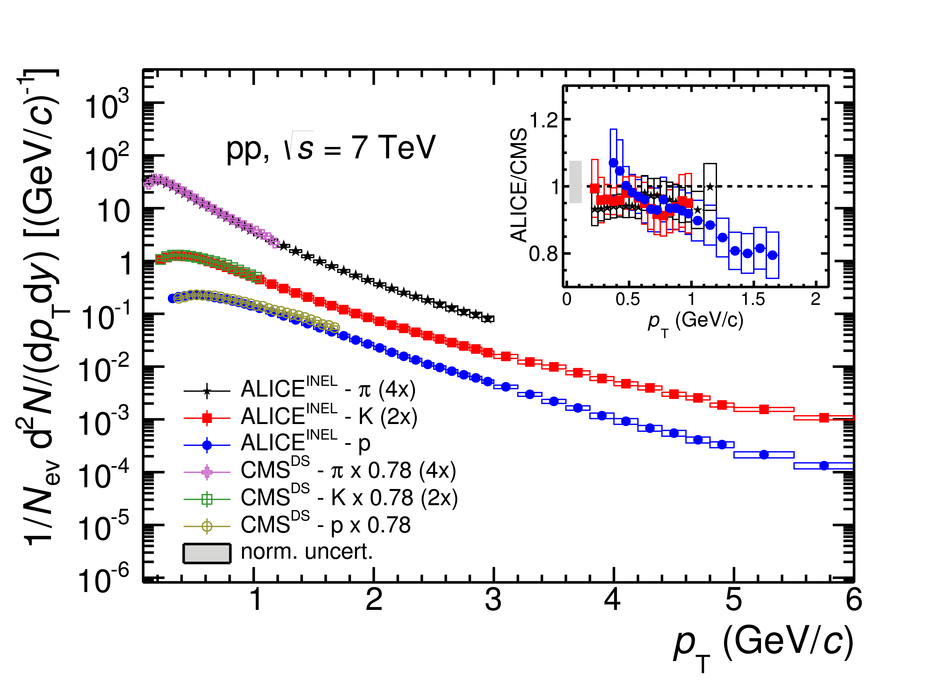 |