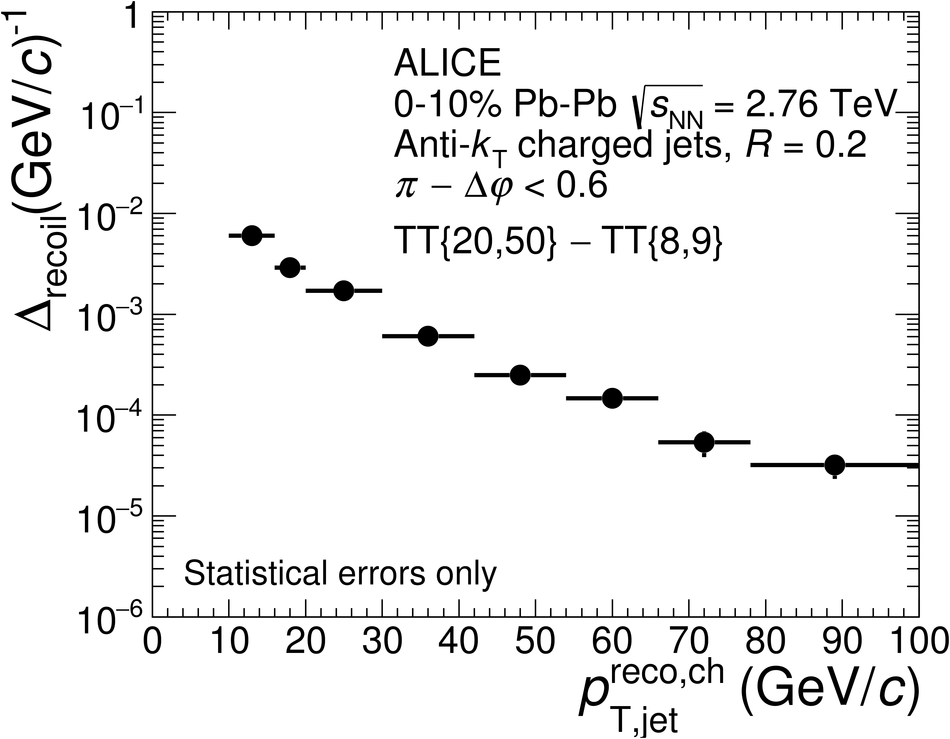
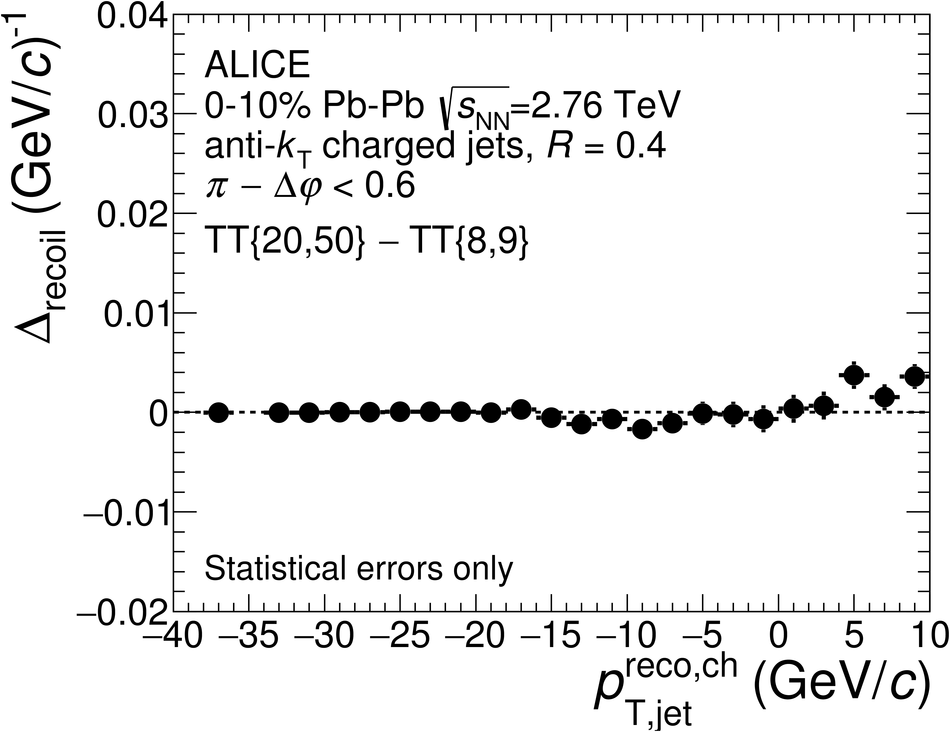
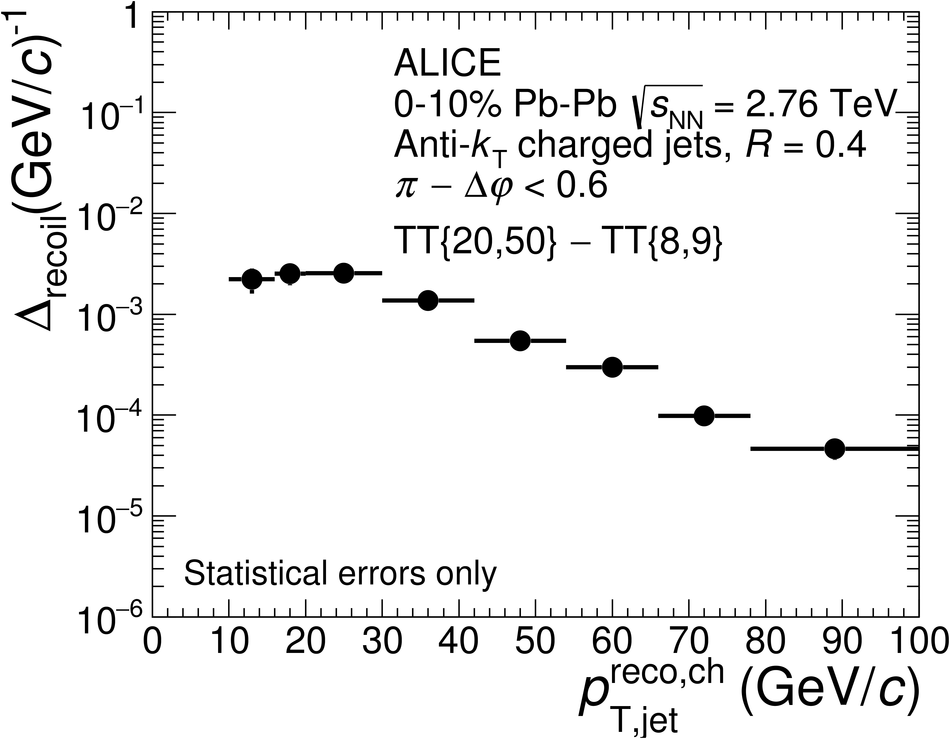
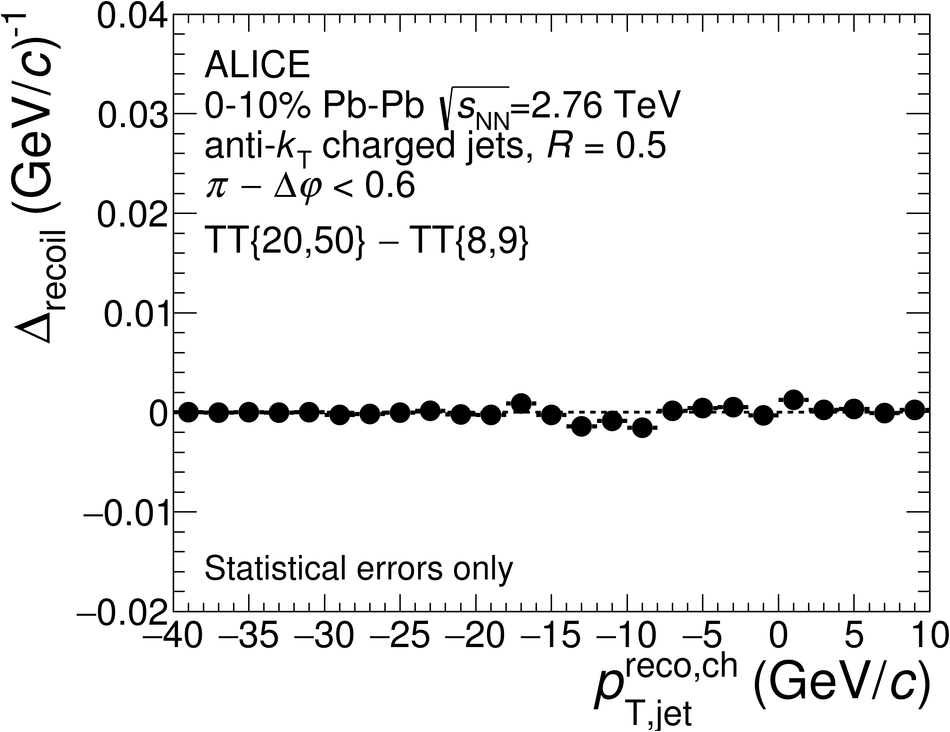
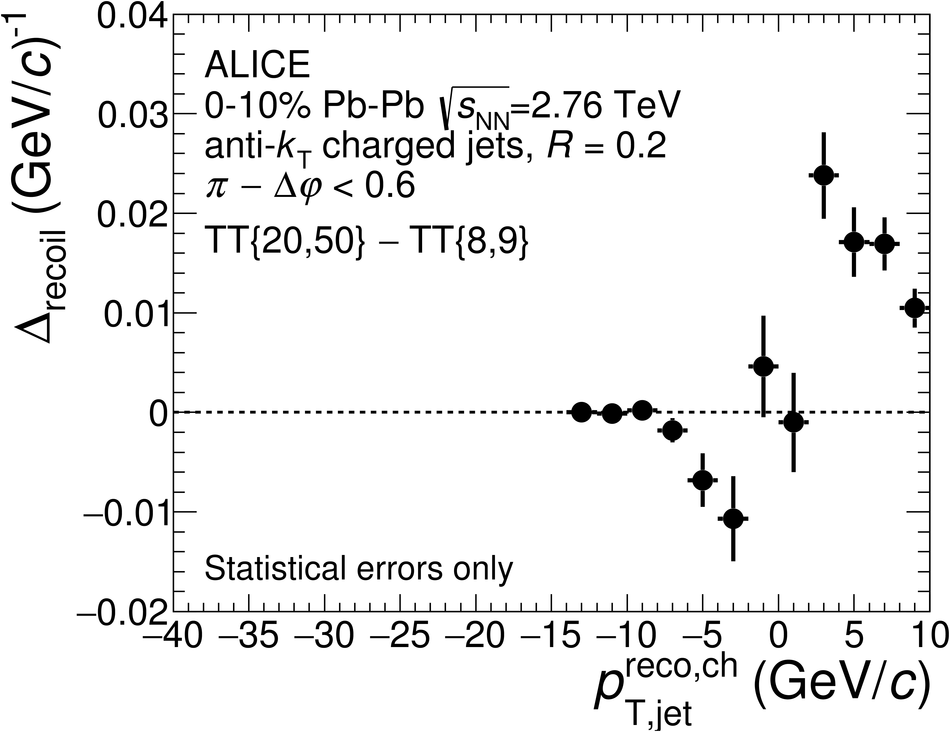
Distribution of raw $\Delta_\mathrm{recoil}$ for ${R}$ = 0.2, 0.4, and 0.5, measured in central Pb-Pb collisions for Signal TT class {20,50} and Reference TT class {8,9}. First three pannels (from top): $p_\mathrm{T,jet}^\mathrm{reco,ch}$ range of fit to extract $c_\mathrm{Ref}$, with linear vertical scale. Last three pannels (from top): $p_\mathrm{T,jet}^\mathrm{reco,ch}$ range above fit region, with logarithmic vertical scale. Error bars show statistical errors only.
|  |