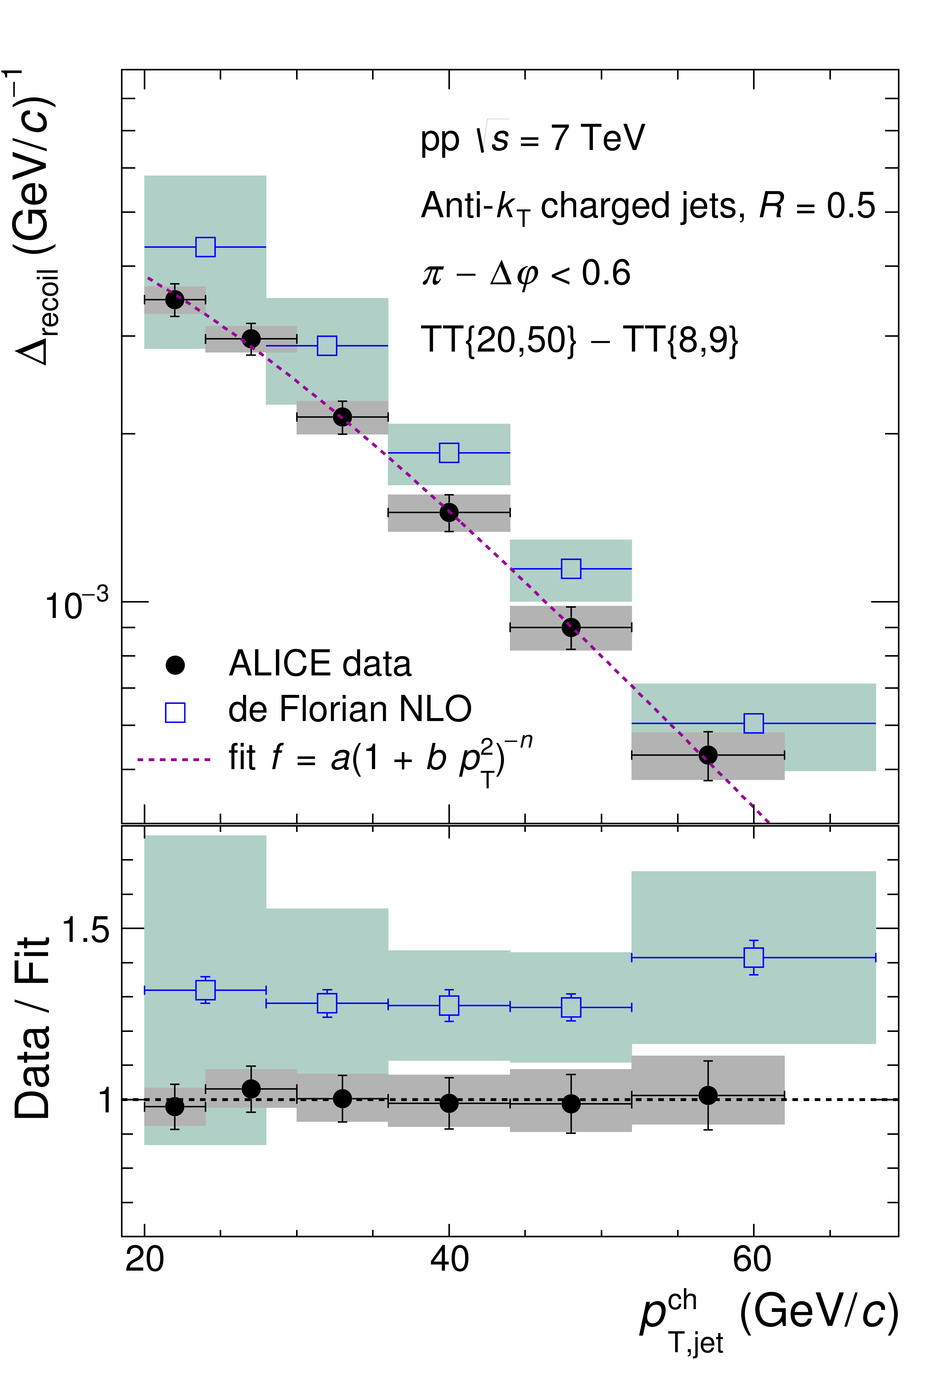
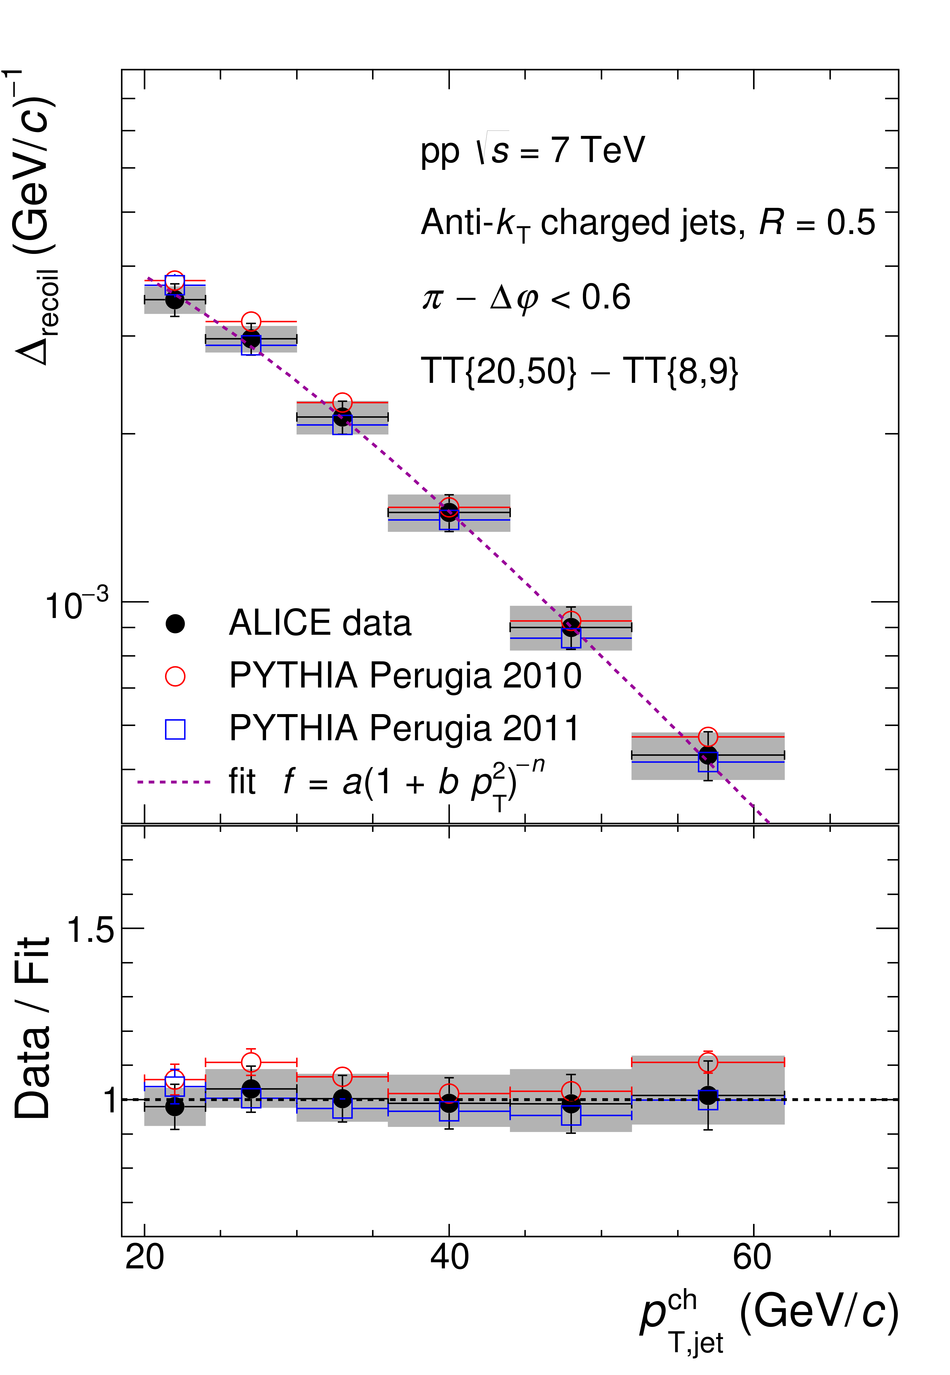
$\Delta_\mathrm{recoil}$ distributions for ${R}$ = 0.5, for ALICE data and calculations of pp collisions $\sqrt{s}$ = 7 TeV. ALICE data, which are the same in both panels, are compared with calculations based on PYTHIA (top) and NLO pQCD (bottom). The green boxes in the bottom panel show the systematic uncertainty of the NLO calculation. The lower panels show the ratios of data and calculations to a smooth function fit to the data.
|  |