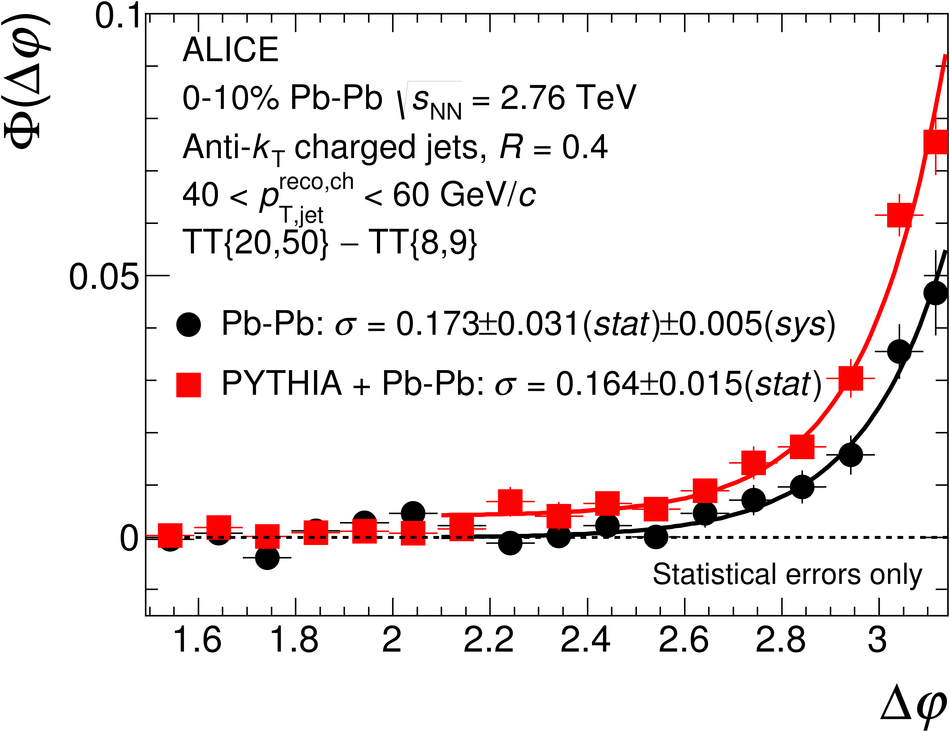
$\Phi(\dphi)$ distributions for 0-10% central Pb-Pb data (black circles) and pp collisions simulated by detector-level PYTHIA events embedded into central Pb-Pb events (red squares), at $\sqrt{s_{\mathrm {NN}}}$ = 2.76 TeV. Jets have $40< p_\mathrm{T,jet}^\mathrm{reco,ch} < 60$, with $p_\mathrm{T,jet}^\mathrm{reco,ch}$ not corrected for background fluctuations and instrumental effects. The lines show the result of fitting Eq.8 to the distributions, with the value of $\sigma$ from the fit as indicated. The error bars show statistical errors only. The Pb-Pb data points are the same as the solid circles shown in the top panel of Fig.4.
|  |