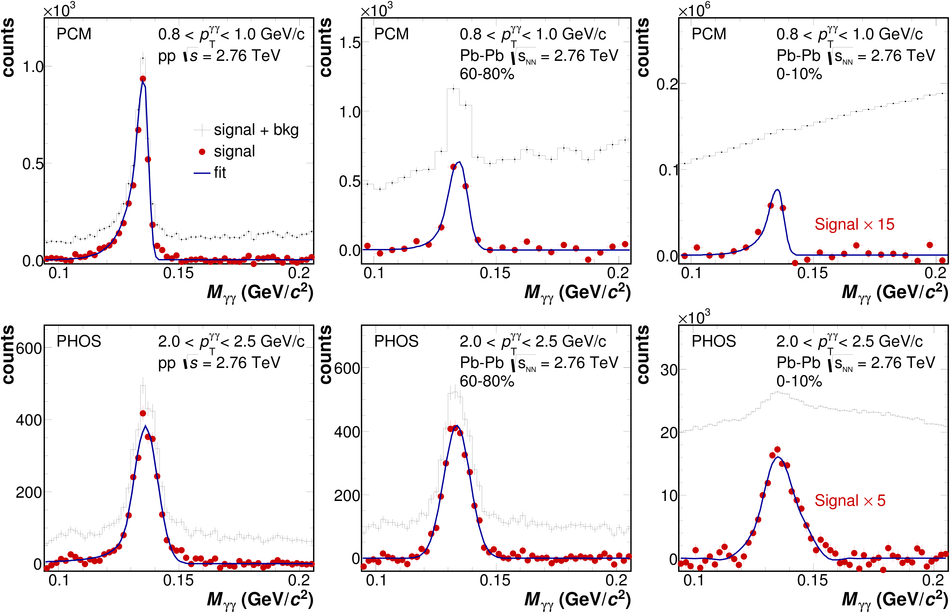
Invariant mass spectra in selected $pT$ slices for PCM (upper row) and PHOS (lower row) in the $\pi^0$ mass region for pp (left column), $60-80\%$ (middle column) and $0-10\%$ (right column) Pb-Pb collisions. The histogram and the filled points show the data before and after background subtraction, respectively. For the $0-10\%$ class the invariant mass distributions after background subtraction were scaled by a factor 15 and 5 for PCM and PHOS, respectively, for better visibility of the peak. The positions and widths of the $\pi^0$ peaks were determined from the fits, shown as blue curves, to the invariant mass spectra after background subtraction.
|  |