Invariant mass distributions of the $\Xi^{-}$ and $\Omega^{-}$ in the 1.1-1.2 \GeVc and 1.2-1.6 \GeVc \pt\ bins respectively, fitted with a Gaussian peak and linear background (dashed red curves). The distributions for highest (left) and lowest (right) multiplicity classes are shown. The fits only serve to illustrate the peak position with respect to which the bands were defined and the linear background assumption for the applied signal extraction method. | 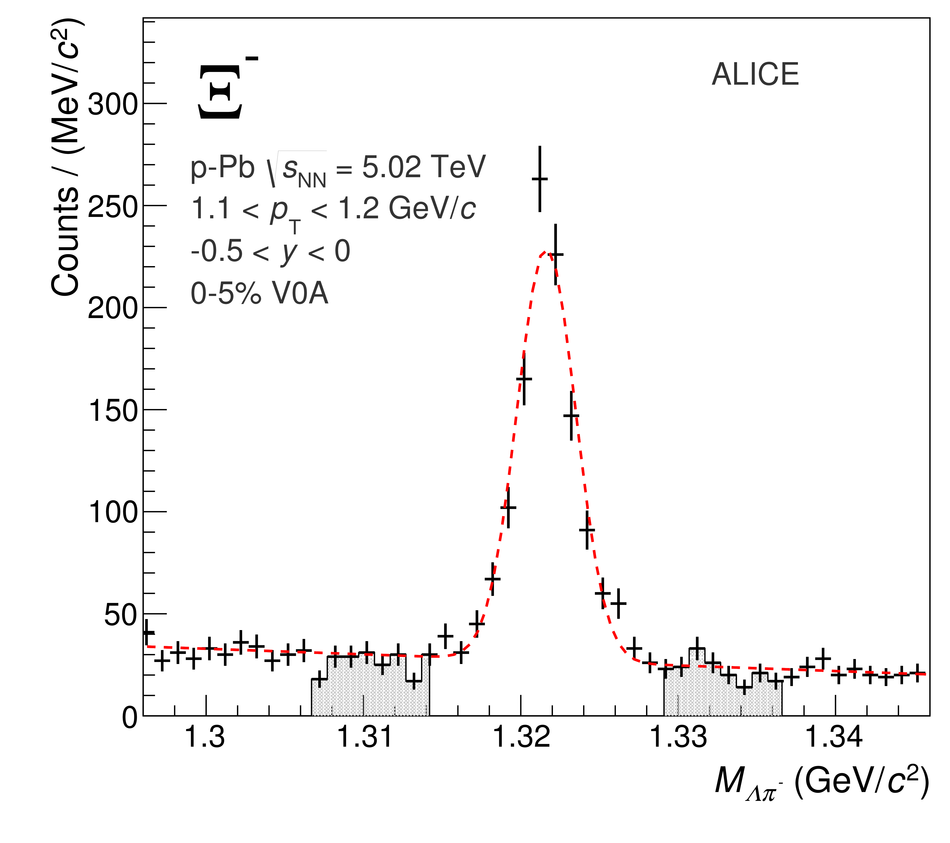 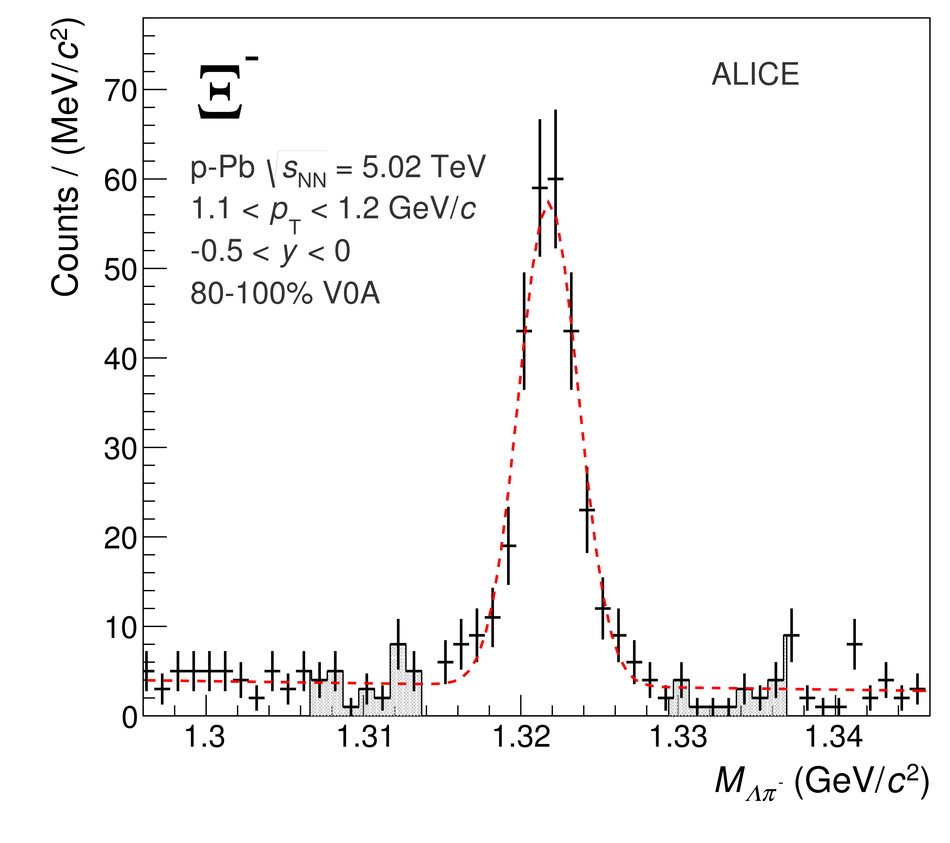 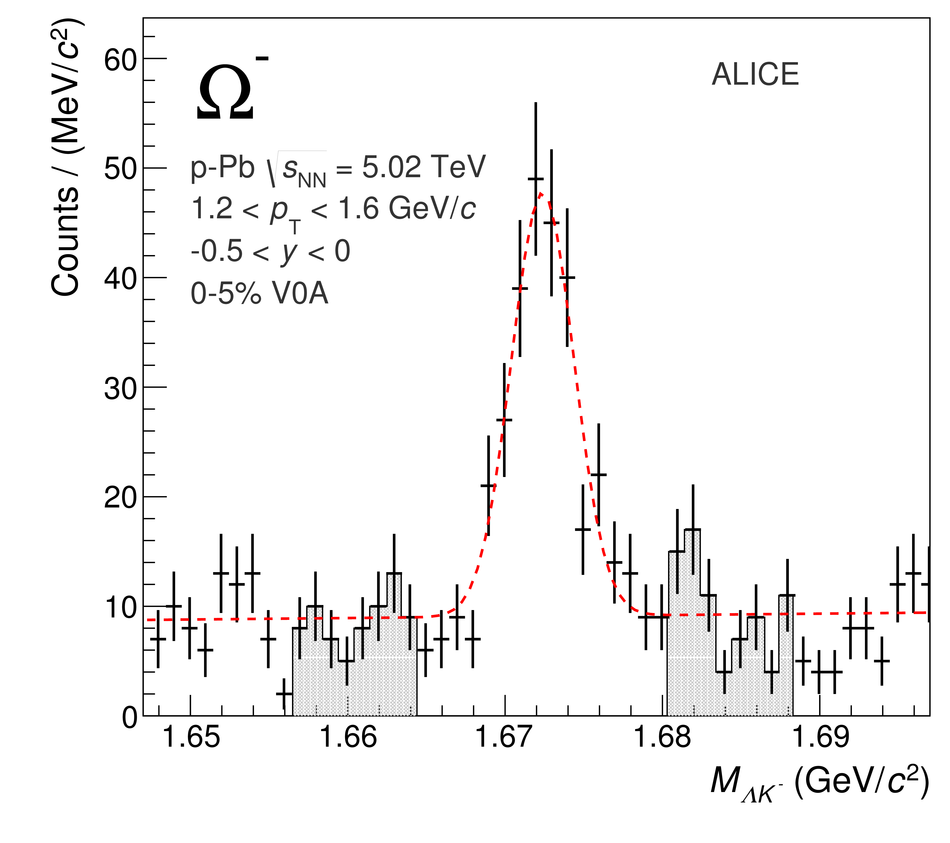 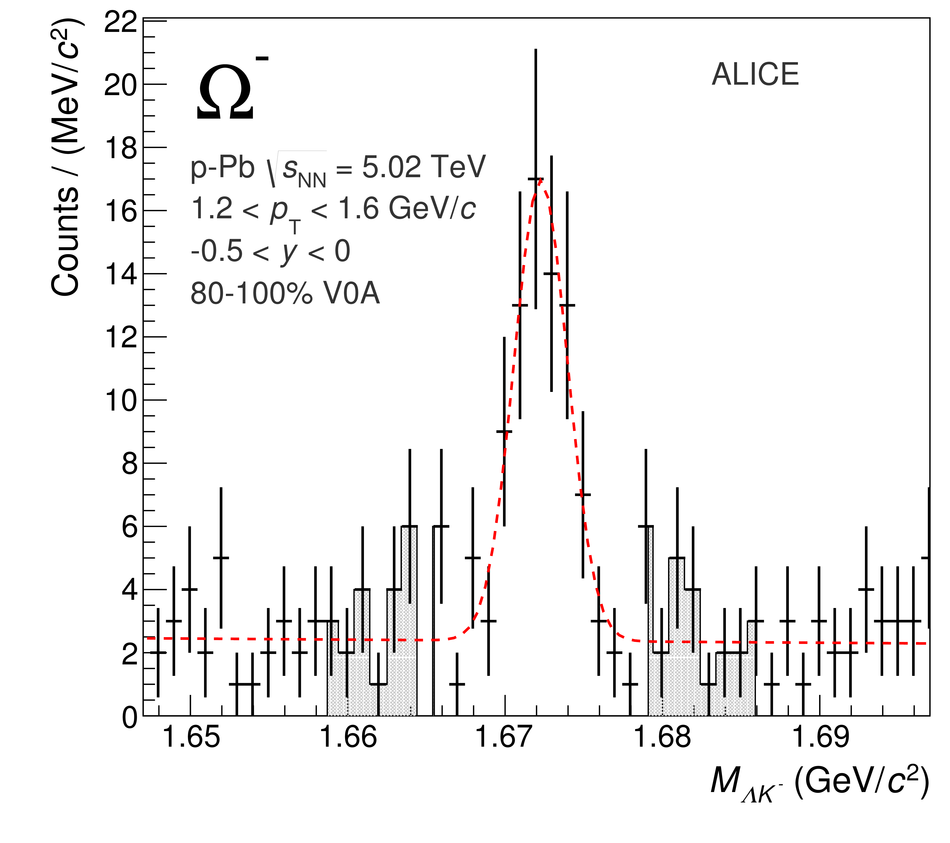 |