The measurement of prompt D-meson production as a function of multiplicity in p-Pb collisions at $\sqrt{s_{\rm NN}}=5.02$ TeV with the ALICE detector at the LHC is reported. D$^0$, D$^+$ and D$^{*+}$ mesons are reconstructed via their hadronic decay channels in the centre-of-mass rapidity range $-0.96<~ y_{\mathrm{cms}}<~0.04$ and transverse momentum interval $1<~p_{\rm T}<~24$ GeV/$c$. The multiplicity dependence of D-meson production is examined by either comparing yields in p-Pb collisions in different event classes, selected based on the multiplicity of produced particles or zero-degree energy, with those in pp collisions, scaled by the number of binary nucleon-nucleon collisions (nuclear modification factor); as well as by evaluating the per-event yields in p-Pb collisions in different multiplicity intervals normalised to the multiplicity-integrated ones (relative yields). The nuclear modification factors for D$^0$, D$^+$ and D$^{*+}$ are consistent with one another. The D-meson nuclear modification factors as a function of the zero-degree energy are consistent with unity within uncertainties in the measured $p_{\rm T}$ regions and event classes. The relative D-meson yields, calculated in various $p_{\rm T}$ intervals, increase as a function of the charged-particle multiplicity. The results are compared with the equivalent pp measurements at $\sqrt{s}=7$ TeV as well as with EPOS~3 calculations.
JHEP 8 (2016) 1-44
HEP Data
e-Print: arXiv:1602.07240 | PDF | inSPIRE
CERN-EP-2016-034
Figure 1
Distributions of the invariant mass for $\Dzero$ (left column) and $\Dplus$ (middle column) candidates and of the mass difference for $\Dstar$ candidates (right column) in two centrality classes defined with the ZNA estimator: 0-20% and 60-100%. The red lines in each plot represent the fit to the background, and the blue lines represent the sum of signal and background. One $\pt$ interval is shown for each meson species: $2< \pt< 4$ GeV/$c$ for $\Dzero$, $4< \pt< 6$ GeV/$c$ for $\Dplus$, and $6< \pt< 8$ GeV/$c$ for $\Dstar$. |  |
Figure 2
$\Dzero$, $\Dplus$ and $\Dstar$ meson nuclear modification factors as a function of $\pt$ for: (a) the 0-20% centrality class and (b) the 40-60% centrality class selected with the ZNA estimator. The vertical error bars and the empty boxes represent the statistical and systematic uncertainties, respectively. The grey-filled box at $Q_{\mathrm{pPb}}=1$ represents the normalisation uncertainty. Symbols are displaced from the bin centre for clarity | 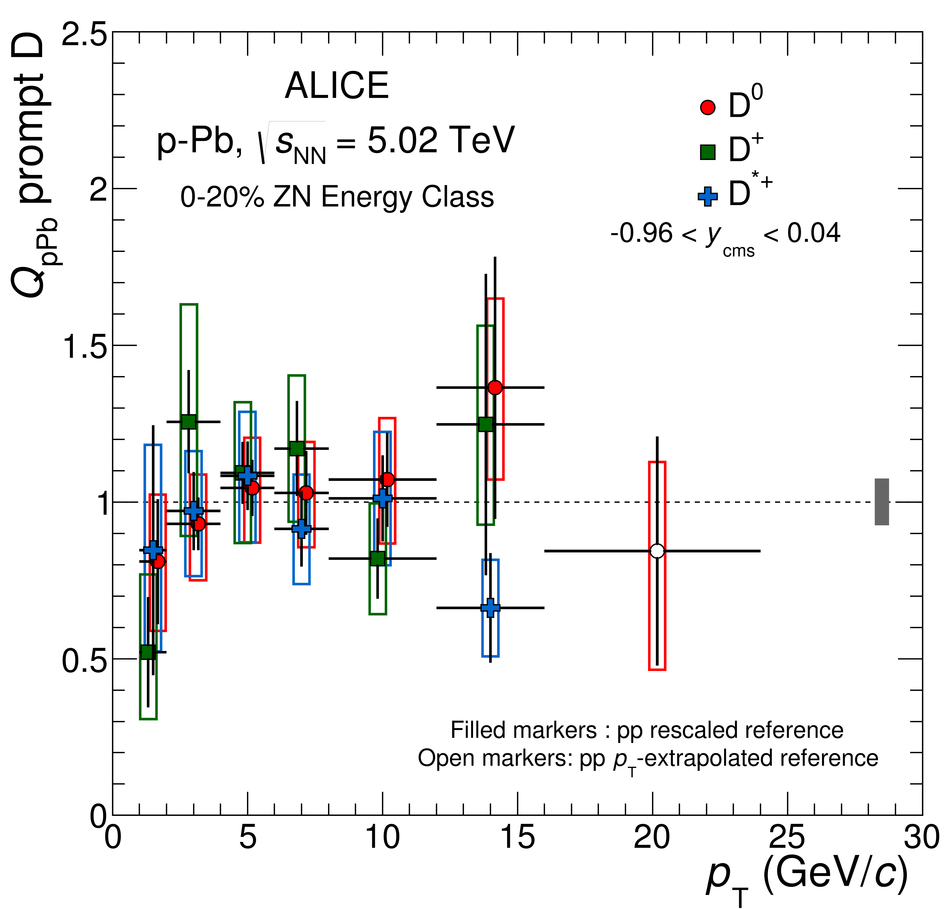 |
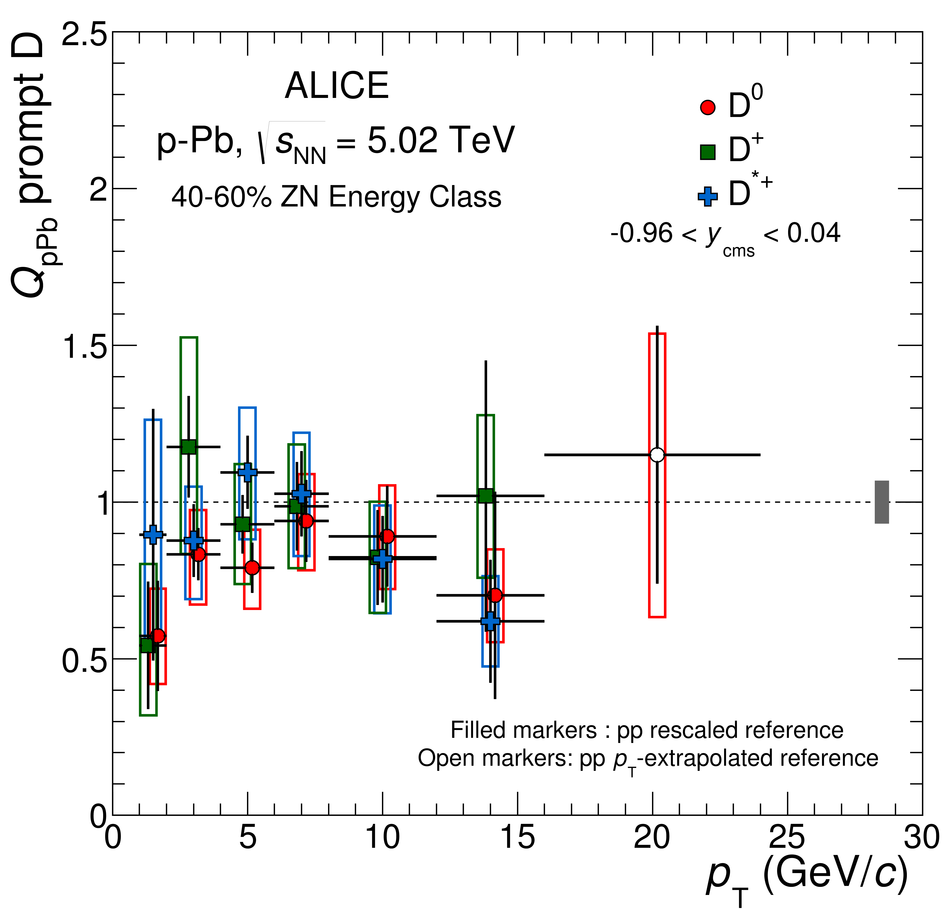
Figure 3
Average $\Dzero$, $\Dplus$ and $\Dstar$ meson nuclear modification factors as a function of $\pt$ in the 0-20%, 20-40%, 40-60% and 60-100% centrality classes selected with the ZNA estimator The vertical error bars and the empty boxes represent the statistical and systematic uncertainties, respectively. The colour-filled boxes at $\QpPb=1$ represent the normalisation uncertainties Symbols are displaced from the bin centre for clarity |  |
Figure 4
Average $\Dzero$, $\Dplus$ and $\Dstar$ meson nuclear modification factors as a function of $\pt$ in the 0-20%, 20-40%, 40-60% and 60-100% centrality classes selected with: (a) the CL1 estimator, and (b) the V0A estimator The vertical error bars and the empty boxes represent the statistical and systematic uncertainties, respectively. The colour-filled boxes at $\QpPb=1$ represent the normalisation uncertainties Symbols are displaced from the bin centre for clarity | 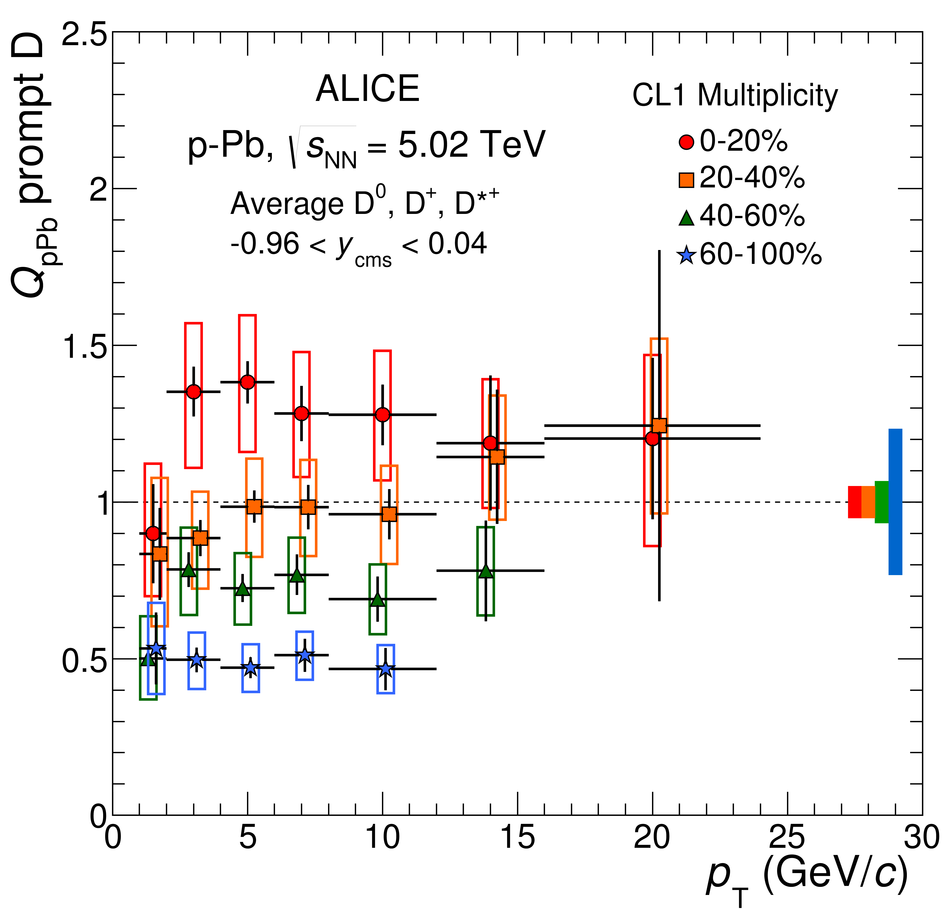 |
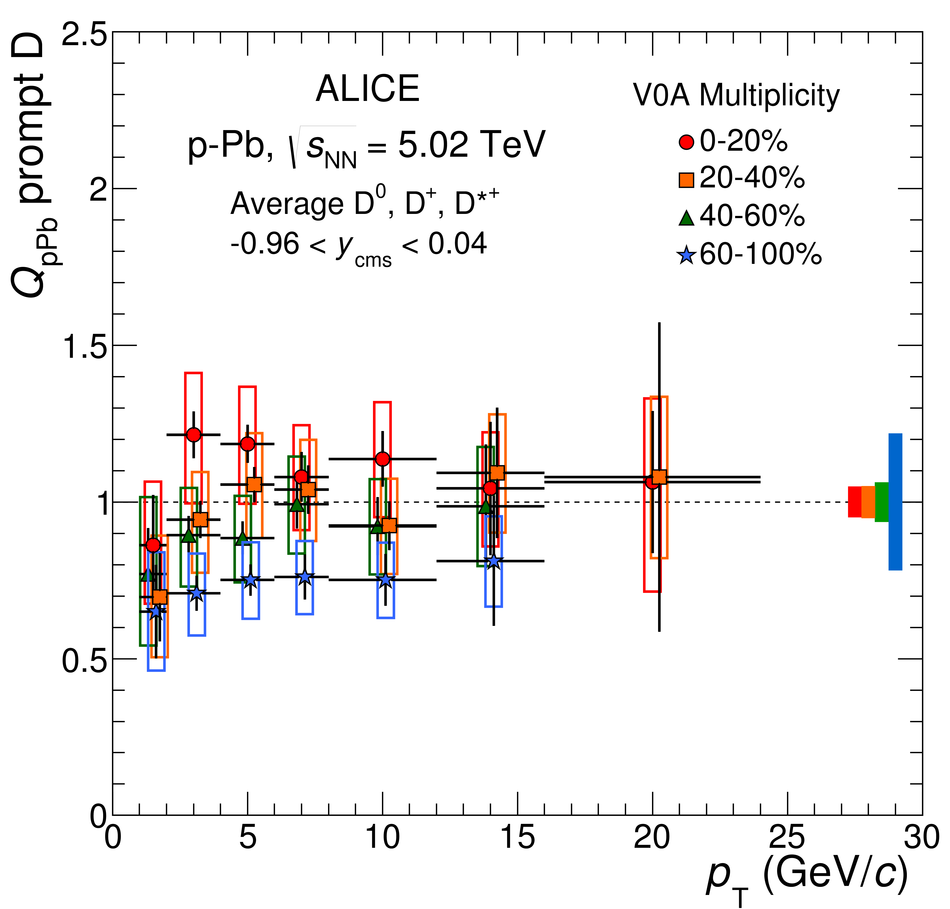
Figure 5
Average $\Dzero$, $\Dplus$ and $\Dstar$ meson $\QpPb$ as a function of centrality with the CL1, the V0A and the ZNA estimators for (a) $2< \pt< 4 \gevc$ and (b) $8< \pt< 12 \gevc$. The average D-meson $\QpPb$ in $8< \pt< 12 \gevc$ is compared with the charged-particle $\QpPb$ calculated for $\pt>10 \gevc$ The vertical error bars and the empty boxes represent, respectively, the statistical and systematic uncertainties on the D-meson results The filled boxes at $\QpPb=1$ indicate the correlated systematic uncertainties: the grey-filled box represents the uncertainty on the pp reference and the p-Pb analysis PID and track selection uncertainties, common to all estimators for a given $\pt$ interval; the red-filled box represents the correlated systematic uncertainty on $\Ncoll$ determination for the ZNA energy estimator | 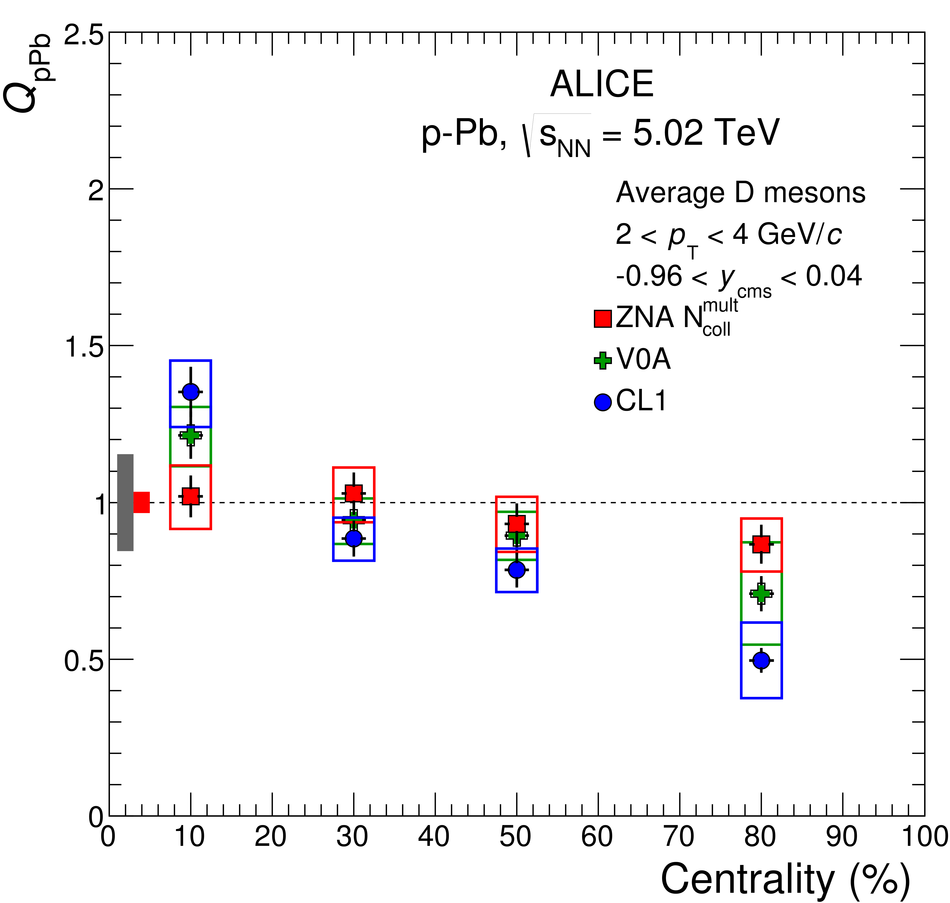 |

Figure 6
Relative $\Dzero$, $\Dplus$ and $\Dstar$ meson yields for two selected $\pt$ intervals as a function of charged-particle multiplicity at central rapidity The relative yields are presented in the top panels with their statistical (vertical bars) and systematic (empty boxes) uncertainties, apart from the feed-down fraction uncertainty, which is drawn separately in the bottom panels The position of the points on the abscissa is the average value of $(\dNdEta) \big/ \langle \dNdEta \rangle$ For $\Dplus$ and $\Dstar$ mesons the points are shifted horizontally by $1.5\%$ to improve the visibility The diagonal (dashed) line is also shown to guide the eye | 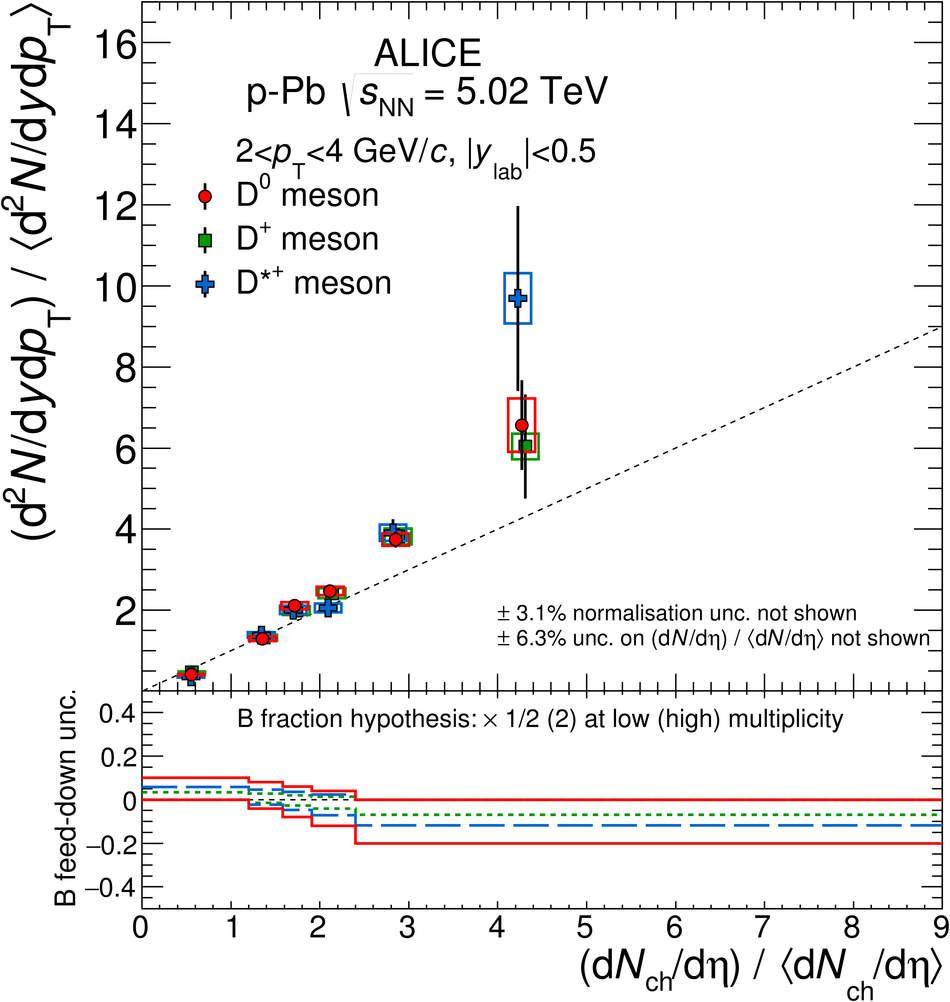 |
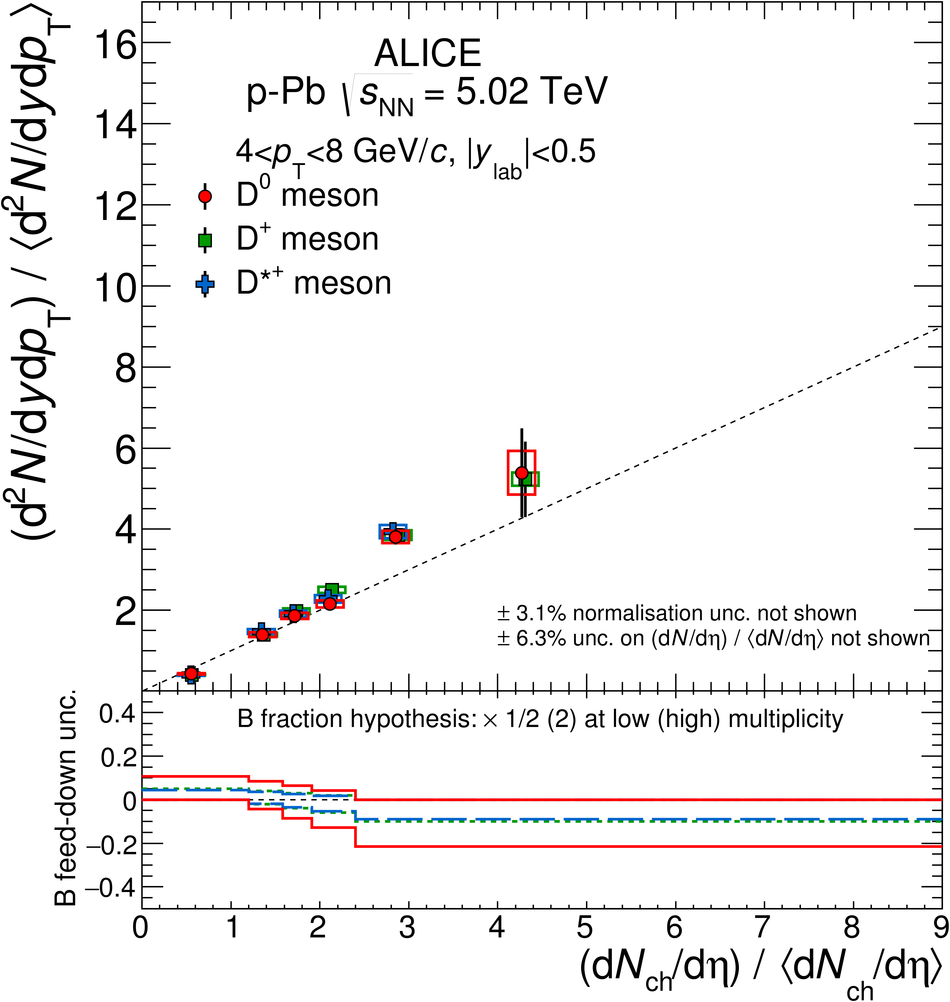
Figure 7
Average of relative $\Dzero$, $\Dplus$ and $\Dstar$ yields as a function of the relative charged-particle multiplicity at central rapidity (a) Average of relative D-meson yields in $\pt$ intervals (b) Ratio of the average relative yields in all $\pt$ intervals with respect to that of the $2< \pt< 4$ Gev/$c$ interval The results are presented in the top panels with their statistical (vertical bars) and systematic (boxes) uncertainties, apart from the feed-down fraction uncertainty, which is drawn separately in the bottom panels The position of the points on the abscissa is the average value of $(\dNdEta) \big/ \langle \dNdEta \rangle$ For some $\pt$ intervals the points are shifted horizontally by $1.5%$ to improve the visibility The dashed lines are also shown to guide the eye, a diagonal on (a) and a constant on (b) | 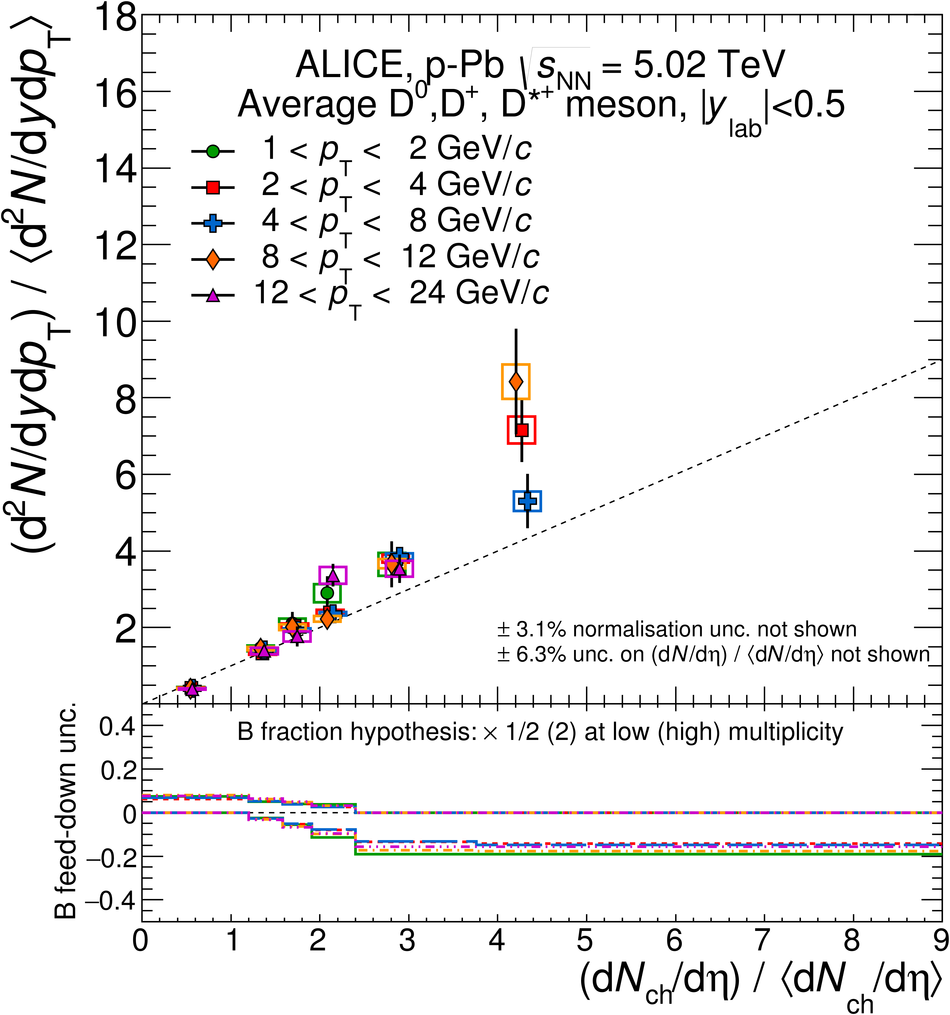 |
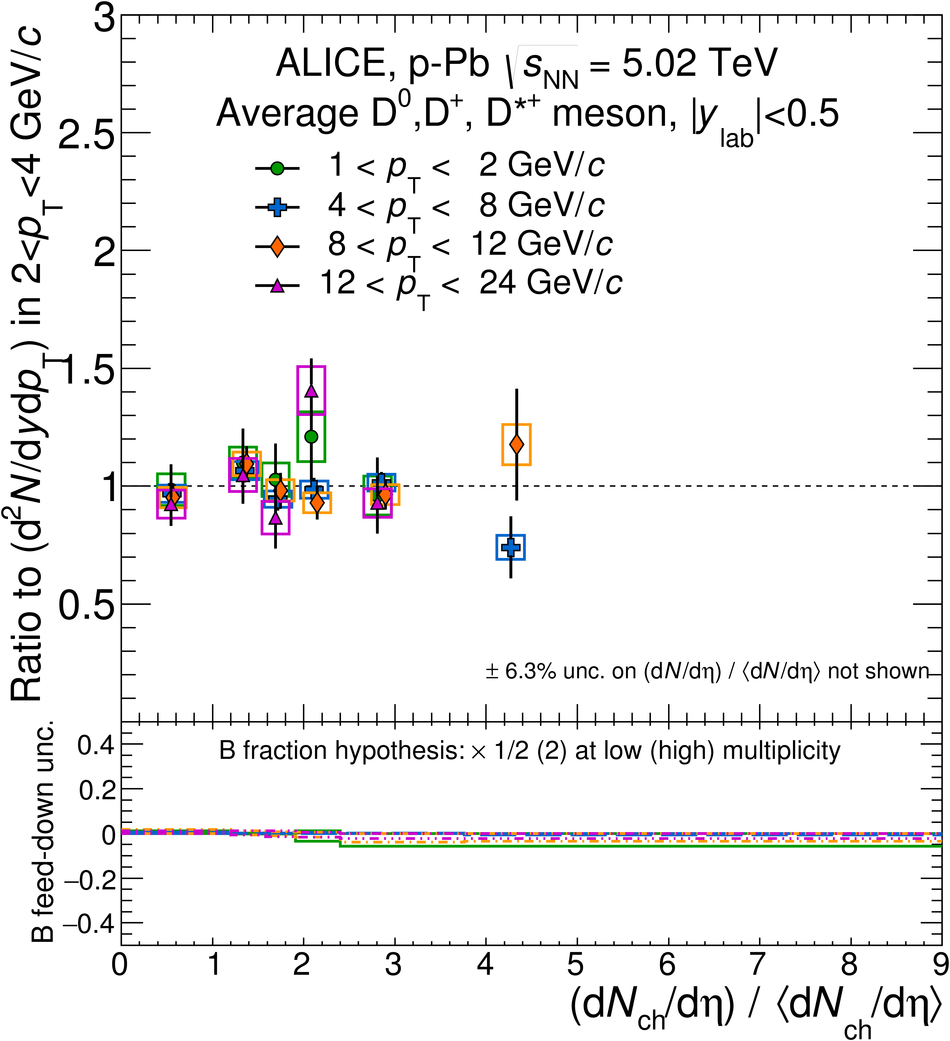
Figure 8
Average of relative $\Dzero$, $\Dplus$ and $\Dstar$ yields as a function of the relative V0A multiplicity, $\Nvzero$, measured at $2.8 < \eta < 5.1$ The relative yields are presented in the top panels with their statistical (vertical bars) and systematic (boxes) uncertainties, apart from the uncertainty on the B feed-down fraction, which is drawn separately in the bottom panels The position of the points on the abscissa is the average value of $\Nvzero \big/ \langle \Nvzero \rangle$ For some $\pt$ intervals the points are shifted horizontally by $1.5\%$ to improve the visibility The dashed lines are also shown to guide the eye, a diagonal on (a) and a constant on (b) | 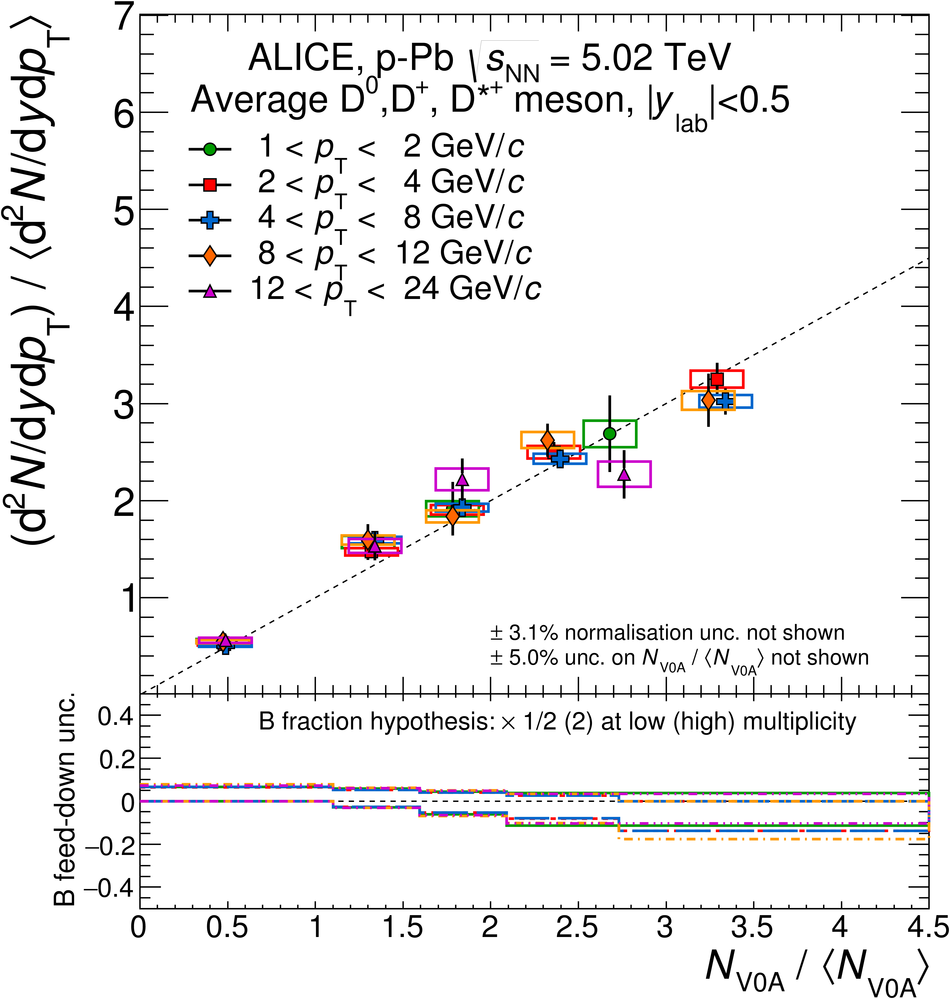 |
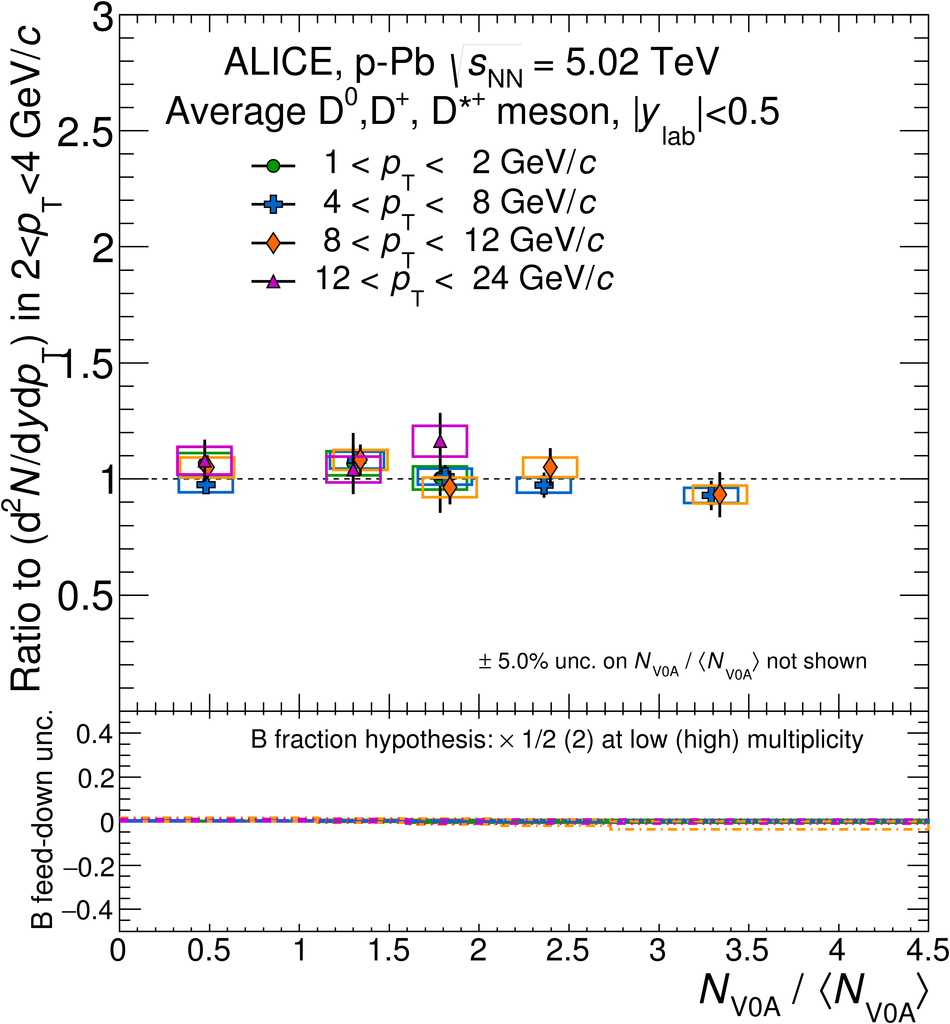
Figure 9
Average relative D-meson yields in $|y_{\rm lab}|< 0.5$ as a function of (a) the relative charged-particle multiplicity at mid-rapidity $|\eta|< 1.0$, and (b) at backward-rapidity $2.8 < \eta < 5.1$ (including also $-3.7 < \eta < -1.7$ in pp data) for $2< \pt< 4 \gevc$ The relative yields are presented in the top panels with their statistical (vertical bars) and systematic (boxes) uncertainties, apart from the uncertainty on the B feed-down fraction, which is drawn separately in the bottom panels The positions of the points on the abscissa are the average values of $(\dNdEta) \big/ \langle \dNdEta \rangle$ or $\Nvzero \big/ \langle \Nvzero \rangle$. A diagonal (dashed) line is also shown to guide the eye |  |
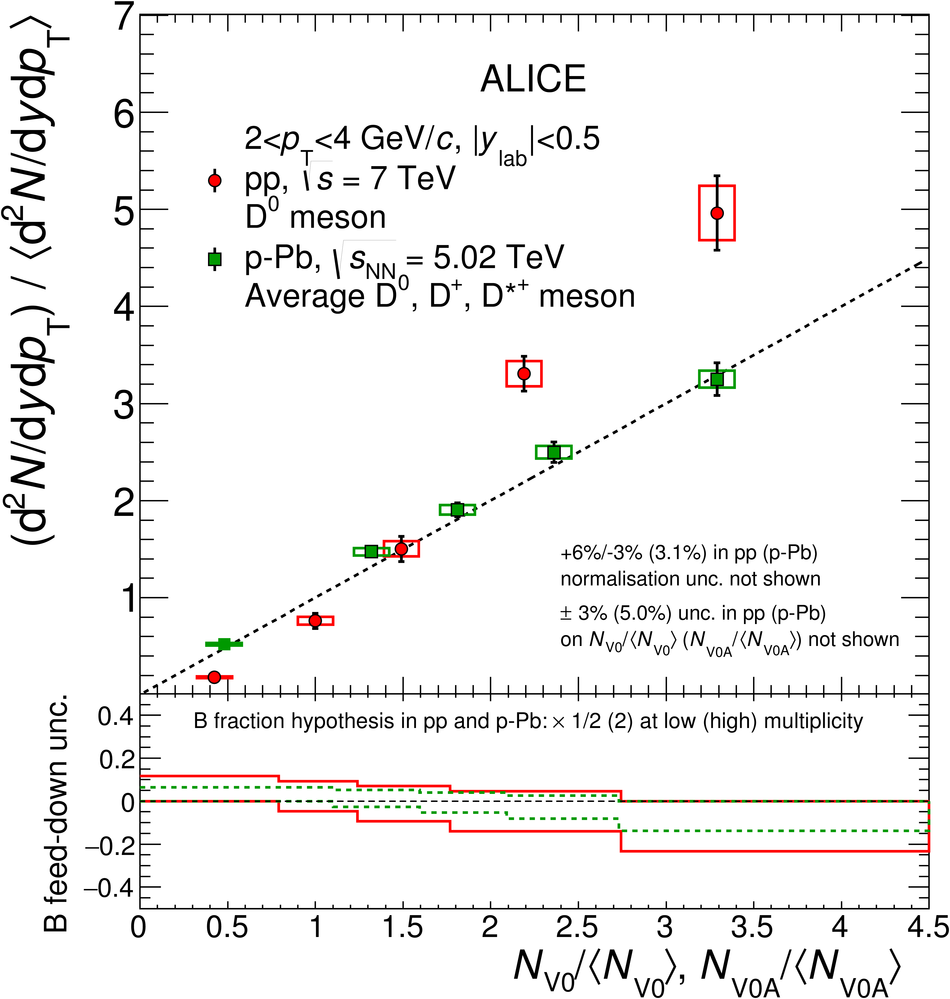
Figure 10
Average relative D-meson yield as a function of the relative charged-particle multiplicity at central rapidity in different $\pt$ intervals The systematic uncertainties on the data normalisation ($\pm3.1\%$), on the $(\dNdEta) \Big/ \langle \dNdEta \rangle$ values ($\pm6.3\%$), and on the feed-down contribution are not shown in this figure The calculations of EPOS 3.116 with and without hydro are also shown The coloured lines represent the calculation curves, whereas the shaded bands represent their statistical uncertainties at given values of $(\dNdEta) \Big/ \langle \dNdEta \rangle$ A diagonal (dashed) line is also shown to guide the eye | 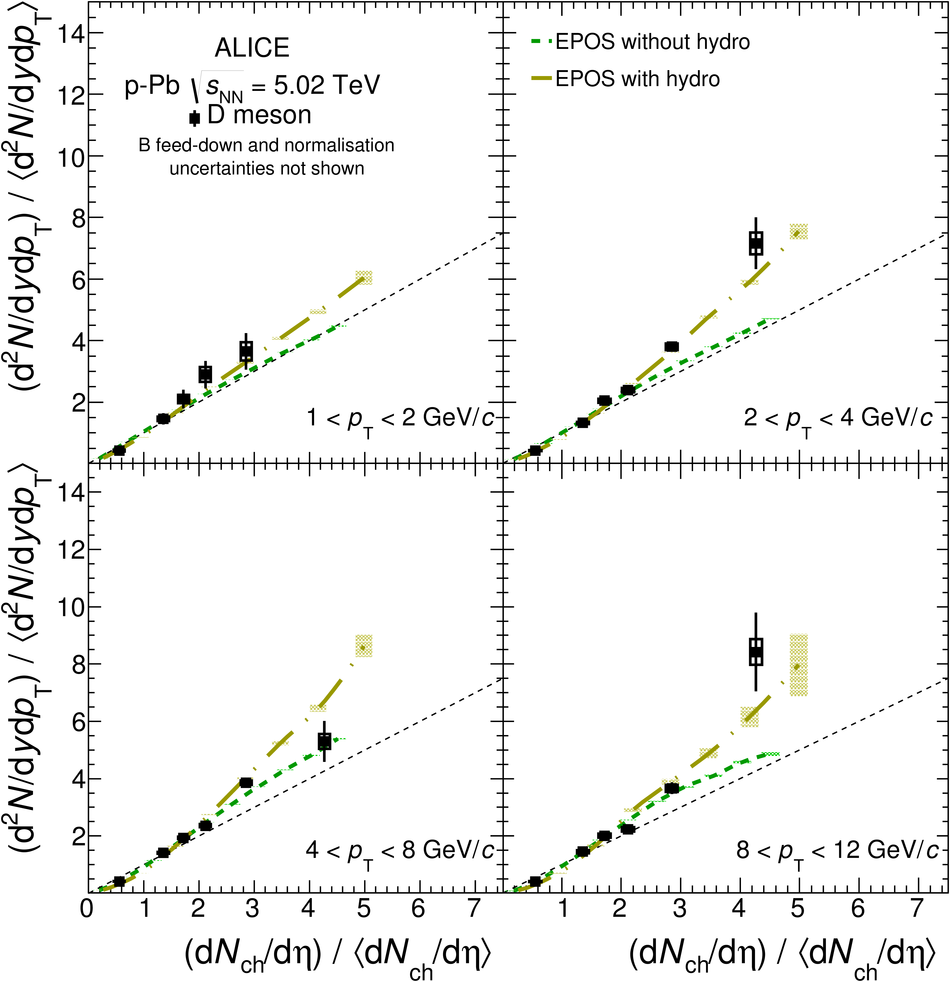 |
Figure 11
Average relative D-meson yield as a function of the relative V0A multiplicity at backward rapidity in different $\pt$ intervals. The systematic uncertainties on the data normalisation ($\pm3.1\%$), on the $\Nvzero \big/ \langle \Nvzero \rangle$ values ($\pm5.0\%$), and on the feed-down contribution are not shown in this figure The calculations of EPOS 3.116 with and without hydro are also shown. The coloured lines represent the calculation curves, whereas the shaded bands represent their statistical uncertainties at given values of $N_\mathrm{V0A} \Big/ \langle N_\mathrm{V0A} \rangle$ A diagonal (dashed) line is also shown to guide the eye | 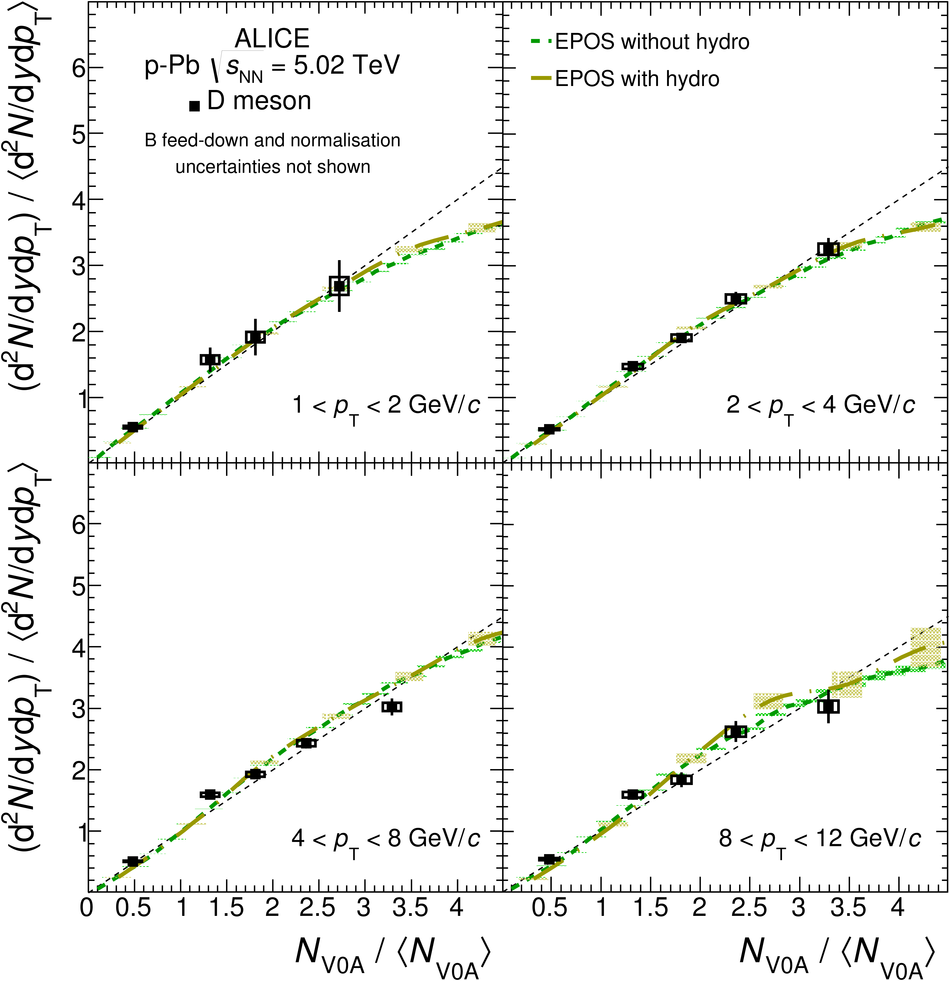 |