Comparison of the D meson $\RAA$ (average of $\Dzero$, $\Dplus$ and $\Dstar$) and of the charged pion $\RAA$ in $5< \pt< 8 $ Gev/$c$ (left) and in $8< \pt< 16 $ Gev/$c$ (right). The right panel also includes the $\RAA$ of non-prompt $\jpsi$ mesons in $6.5< \pt< 30$ Gev/$c$ measured by the CMS Collaboration. The vertical bars represent the statistical uncertainties. The D meson systematic uncertainties are displayed as in the previous figures The total systematic uncertainties of charged pions are shown by boxes The centrality-dependent systematic uncertainties are shown by boxes on the individual data points. | 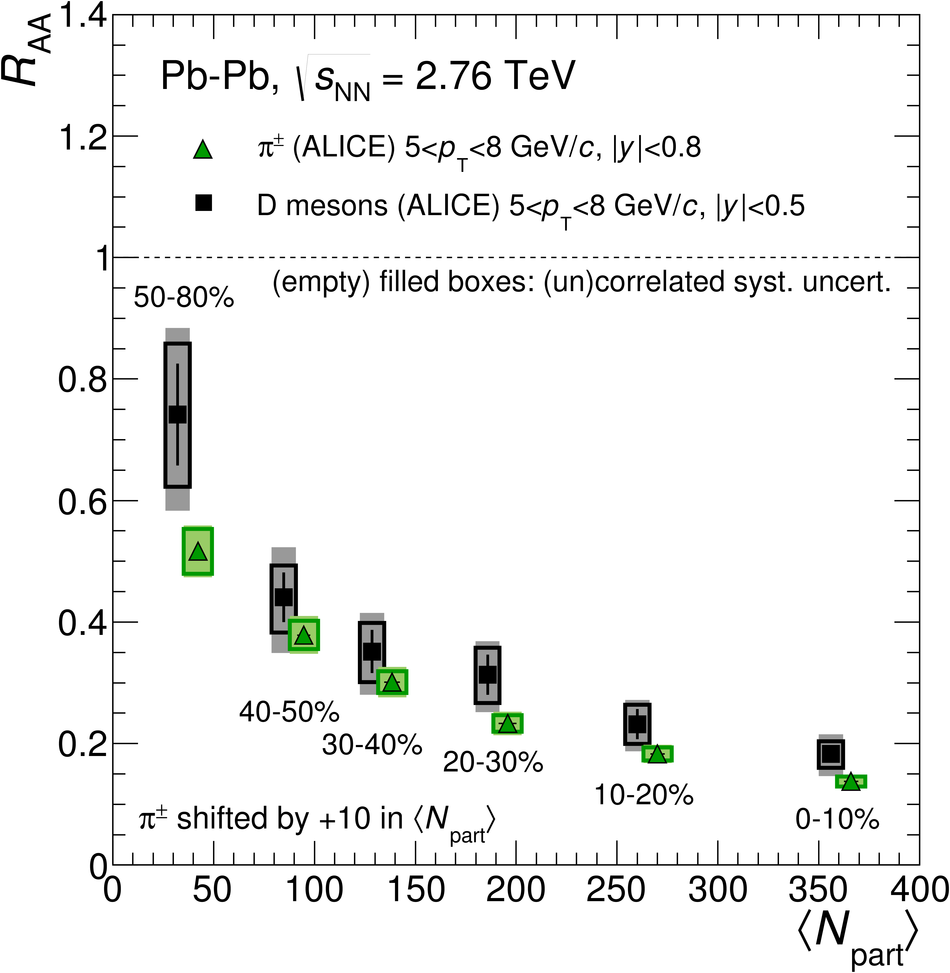 |
