Measurement of d$N_{ch}/$d$\eta$ for all centralities and a broad $\eta$ range. Combined and symmetrised d$N_{ch}/$d$\eta$ over 30-90%
centrality from both SPD and FMD (circles). Open boxes reflect the total uncorrelated systematic uncertainties and statistical errors,
while the filled boxes on the right reflect the correlated systematic uncertainty. Also shown, is the reflection of the $3.5< \eta< 5$
values around $\eta=0$ (open circles). Previously published results for 0-30% over the full pseudorapidity range
(diamonds) [6] are also shown. The lines correspond to fits of Eq.5 to the data. | 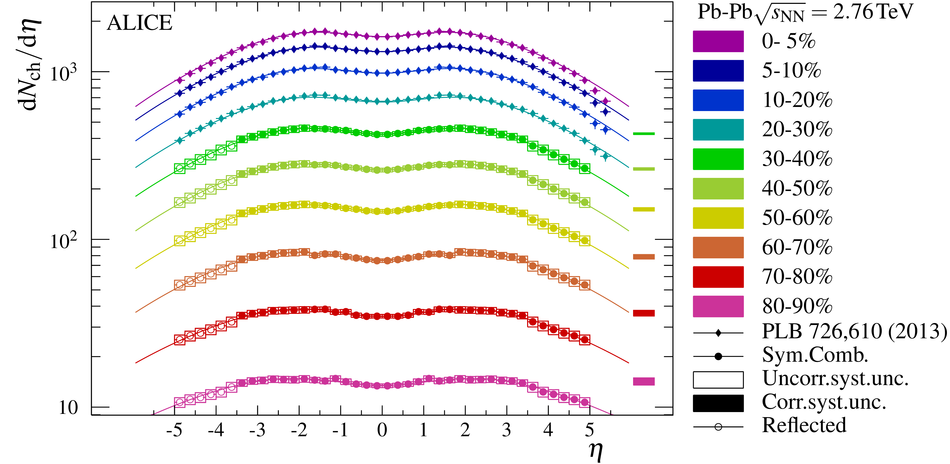 |