Comparison of inclusive photon spectra measured with PCM and PHOS in the 0-20%, 20-40%, and 40-80% centrality classes. The individual spectra were divided by the corresponding combined PCM and PHOS spectrum. The shown errors only reflect the uncertainties of the individual measurements. The boxes around unity indicate normalization uncertainties (type C) | 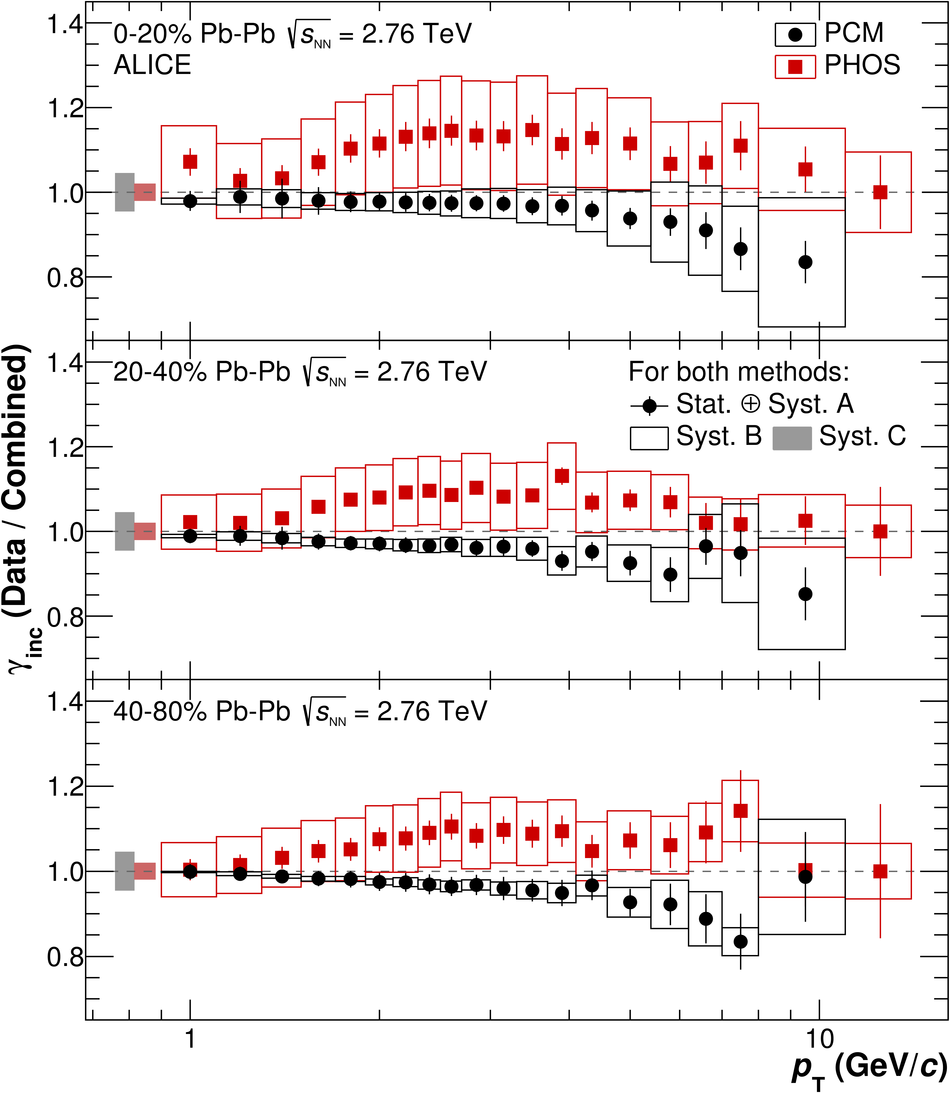 |