Electron selection with the TOF, TRD, and TPC detectors The difference between measured and expected time-of-flight is shown in the upper left panel. Lines indicate the selection band. For tracks selected by TOF,the TRD electron likelihood distribution for tracks with 6 TRD tracklets isshown in the upper right panel. The lower right panel displays the TRD electron likelihood distribution for tracks with an electron efficiency of 80% in the TRD (note the compressed scale on the vertical axis). For tracks passing the TRD selection, the TPC d$E$/d$x$, expressed in units of the d$E$/d$x$ resolution($\sigma_{\rm{TPC}-\rm{d}\mathit{E}/\rm{d}\mathit{x}}$) is shown in the lower left panel. Lines indicate the electron selection band. The parameterisation of the expected energy loss of electronsin this data period, and the specific selection criteria of this analysis are such that the mean (width) of the electron d$E$/d$x$ distribution is not exactly zero (one). Therefore, the selection band is slightly shifted from the nominal values of 0 and 3 $\sigma_{\rm{TPC}-\rm{d}\mathit{E}/\rm{d}\mathit{x}}$. | 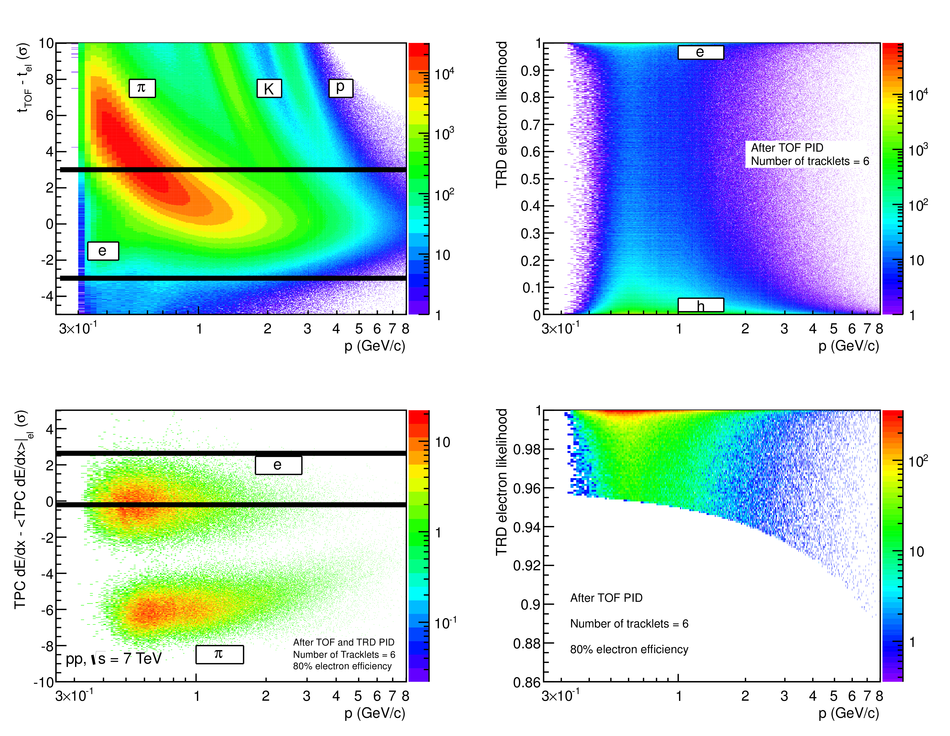 |