Transverse momentum distributions of charged particles in minimum bias (NSD) p-Pb collisions for different pseudorapidity ranges (upper panel). The spectra are scaled by the factors indicated. The histogram represents the reference spectrum in inelastic (INEL) pp collisions (see text). The lower panel shows the ratio of the spectra at forward pseudorapidities to that at $|\eta_{\mathrm{cms}}|< 0.3$. The vertical bars (boxes) represent the statistical (systematic) errors. | 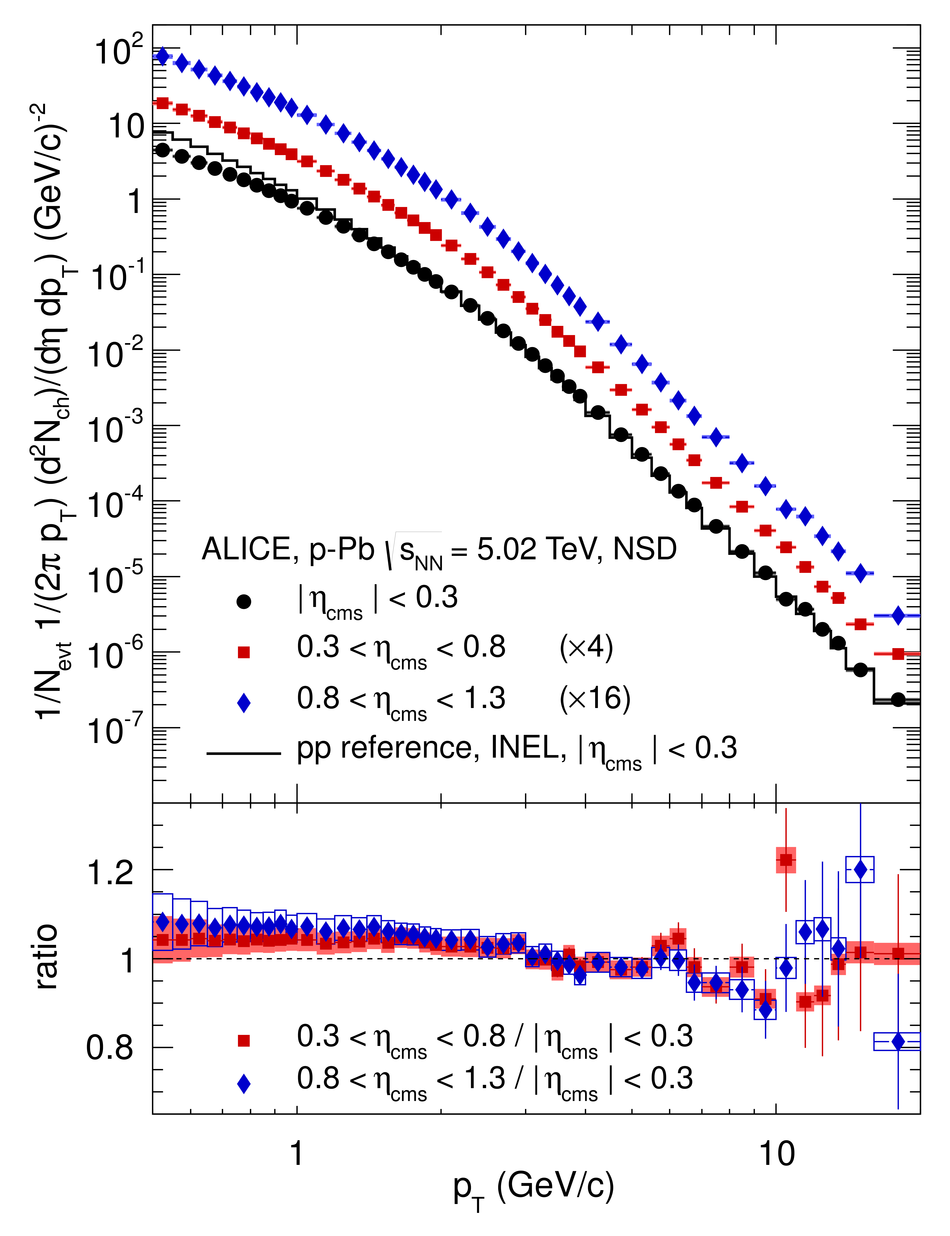 |