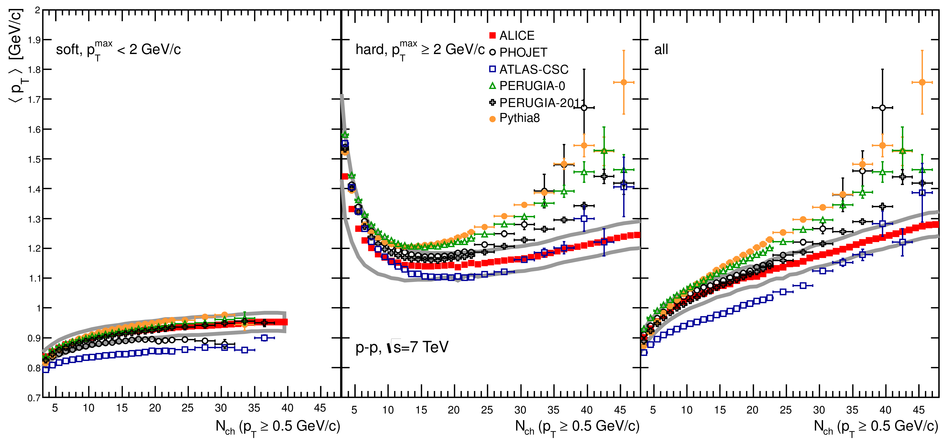
Mean transverse momentum versus multiplicity. The ALICE data are compared with five models: PHOJET, PYTHIA6 (tunes: ATLAS-CSC, PERUGIA-0 and PERUGIA-2011) andPYTHIA8. Results at $\sqrt{s}=0.9$ and 7 TeV are shown in the top and bottom rows, respectively. Different event classes are presented: (left) "soft'', (middle) "hard'' and (right) "all''. The gray lines indicate the systematic uncertainty on data and the horizontal error bars indicate the bin widths. | 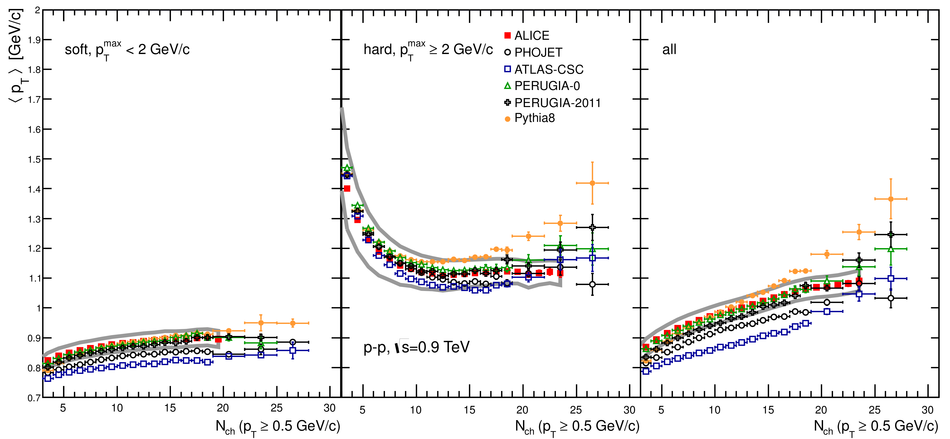 |