Illustration of the fitting procedure for the 10\% most central Pb--Pb events at \snn\ = \unit[2.76]{TeV} in $2< \pta< $ \unit[3]{\gevc} and $3< \ptt< $ \unit[4]{\gevc}. The panels show \protect\subref{subfig:fit1} the two-dimensional azimuthal and pseudorapidity total per-trigger yield, \protect\subref{subfig:fit2} the background distribution and \protect\subref{subfig:fit3} the signal peak component from the fit by Eq. \ref{eq:fit}, and \protect\subref{subfig:fit4} the relative difference between the data and the fit. |  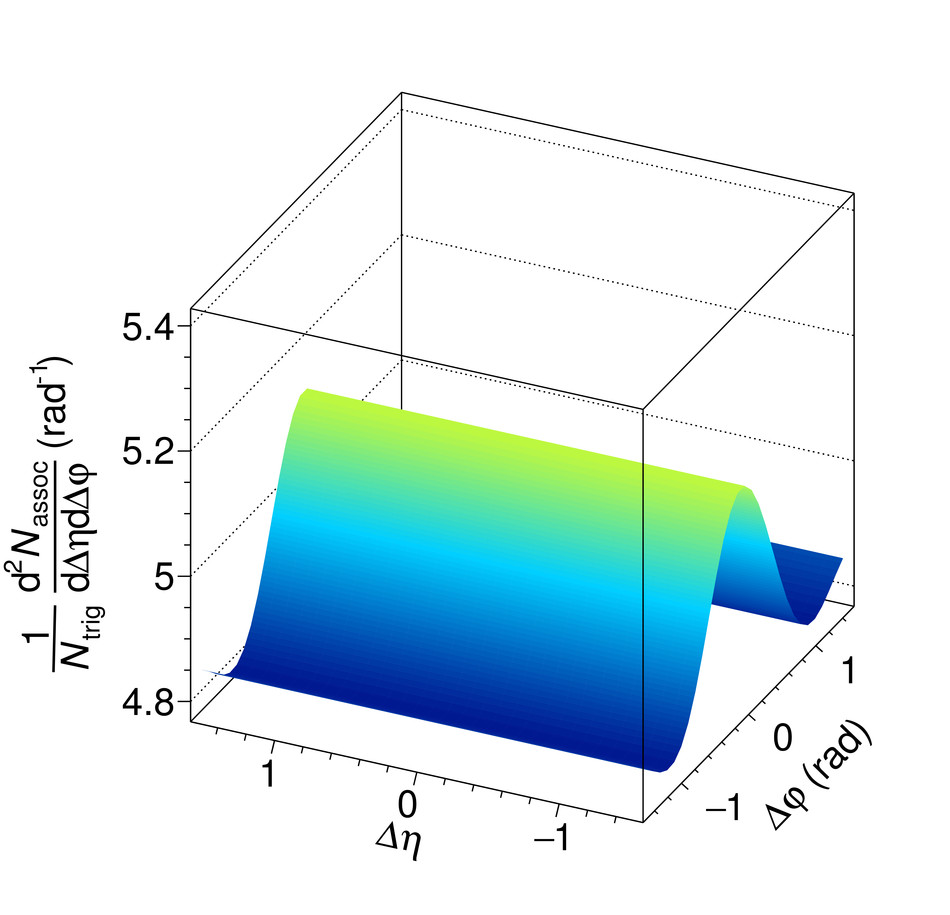 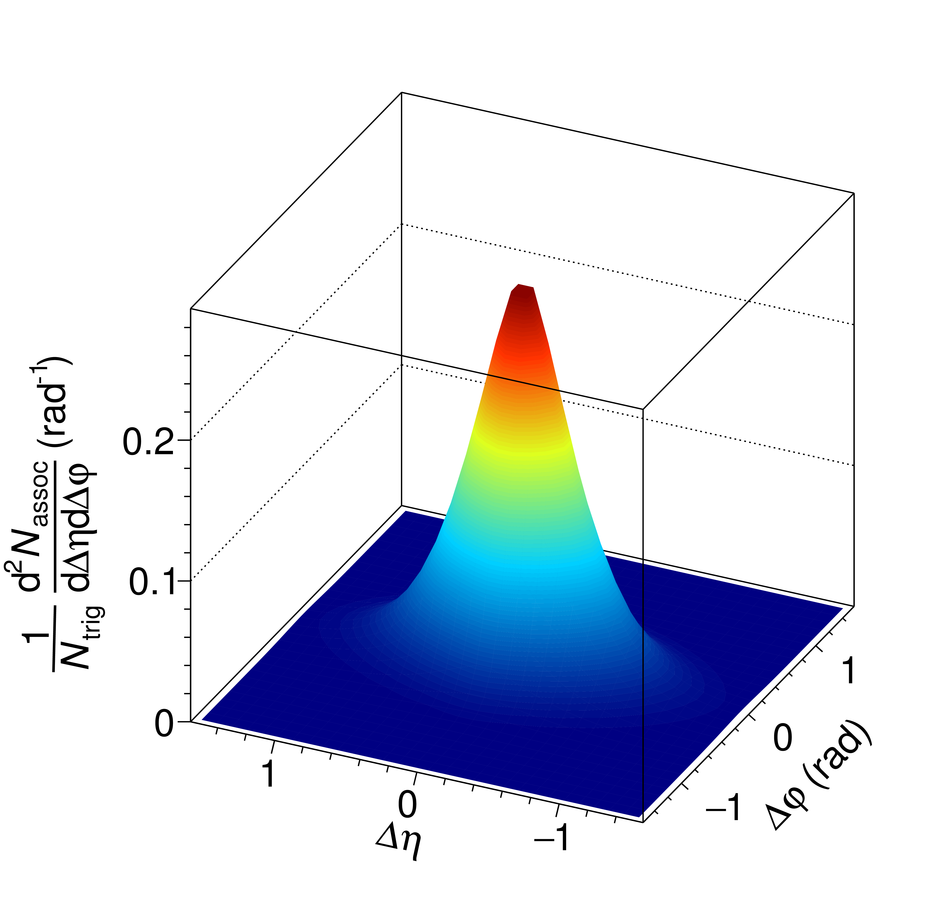 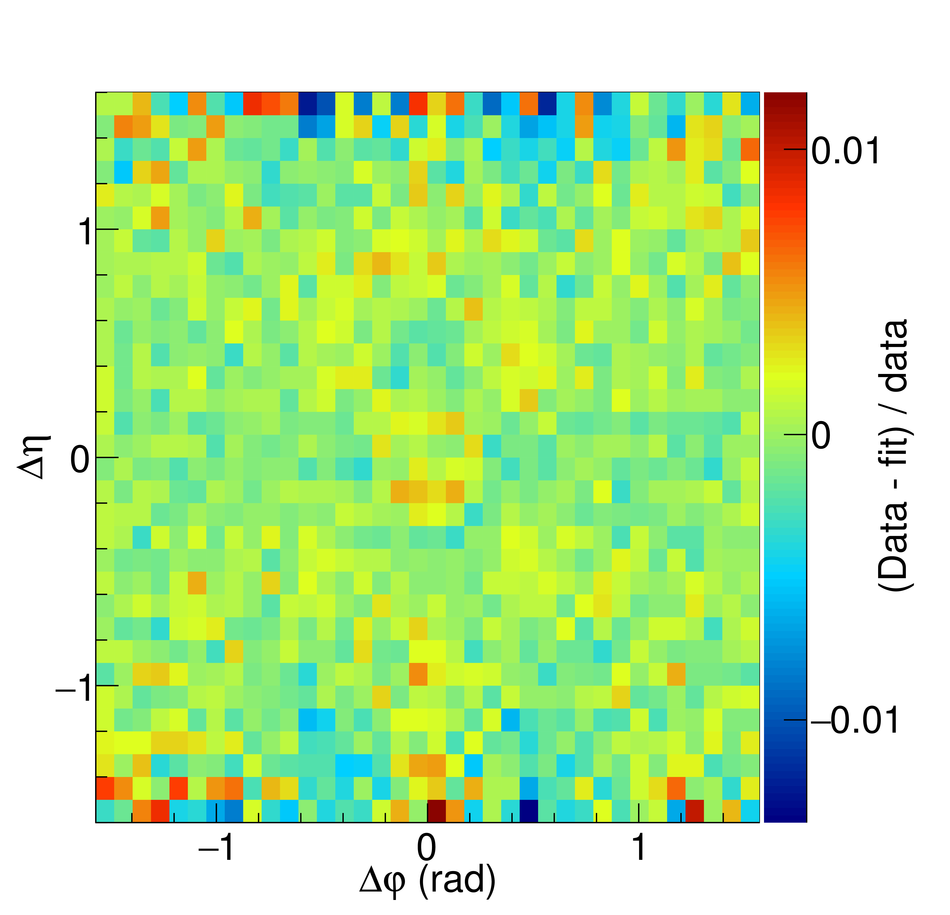 |