Distributions of the invariant mass for $\Dzero$ (left column), $\Dplus$ (middle column) candidates and their charge conjugates and of the mass difference for $\Dstar$ (right column) candidates (and charge conjugates) in p--Pb collisions in the rapidity intervals $|y_{\rm lab}| < 0.1 $ (top row) and $-0.8 < y_{\mathrm{lab}} < -0.4$ ($-0.7 < y_{\mathrm{lab}} < -0.4$ for $\pt< 5 \gev/c$) (bottom row). The dashed lines represent the fit to the background while the solid lines represent the total fit function. One $\pt$ interval is shown for each species: $2< \pt< 5 \gevc$ for $\Dzero$, $5< \pt< 8 \gevc$ for $\Dplus$ and $8< \pt< 16 \gevc$ for $\Dstar$. | 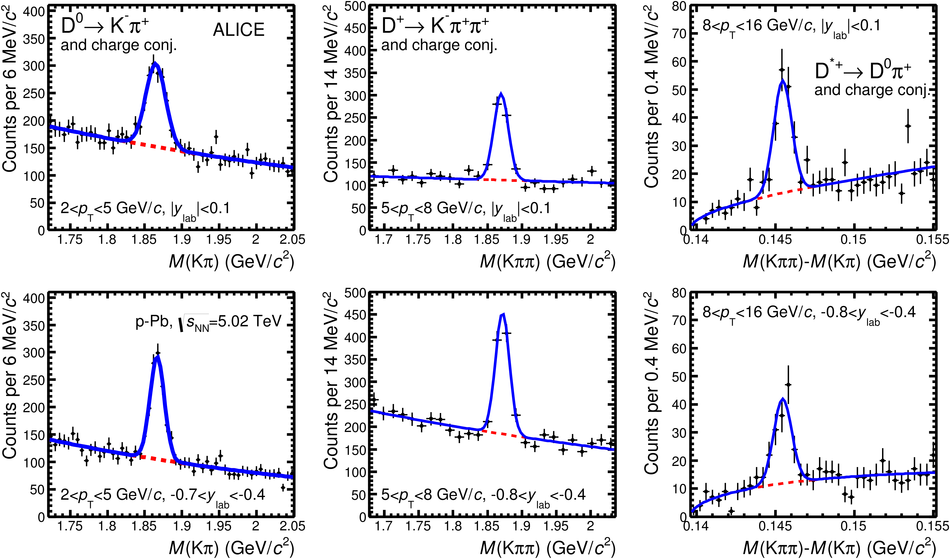 |