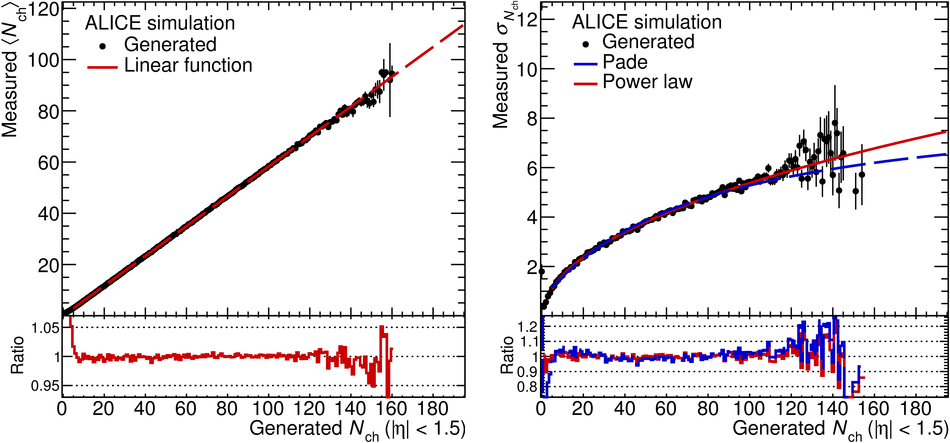
Example of Gaussian parameterization of the response matrix, at $\sqrt{s} =$ 7 TeV, for $|\eta| < 1$: (left) parameterization of the mean values, with a linear function (red dashed line); (right) parameterization of the widths, with a Padé function (red solid line) and a power law function (blue dashed line). The bottom parts of the figures show the ratios between data and fits. |  |