${\rm d}\nch$/${\rm d}\eta$ vs. $\eta$ at $\sqrt{s} = 0.9$ TeV, for the three normalizations defined in the text, and a comparison with ALICE previous measurements , UA5 and CMS . Note that to avoid overlap of data points on the figure, the INEL$>$0 data were displaced vertically, and for these data the scale is to be read off the right-hand side vertical axis. Systematic uncertainties on previous data are shown as error bars (except for UA5, with coloured bands), while they are shown as grey bands for the data from this publication. | 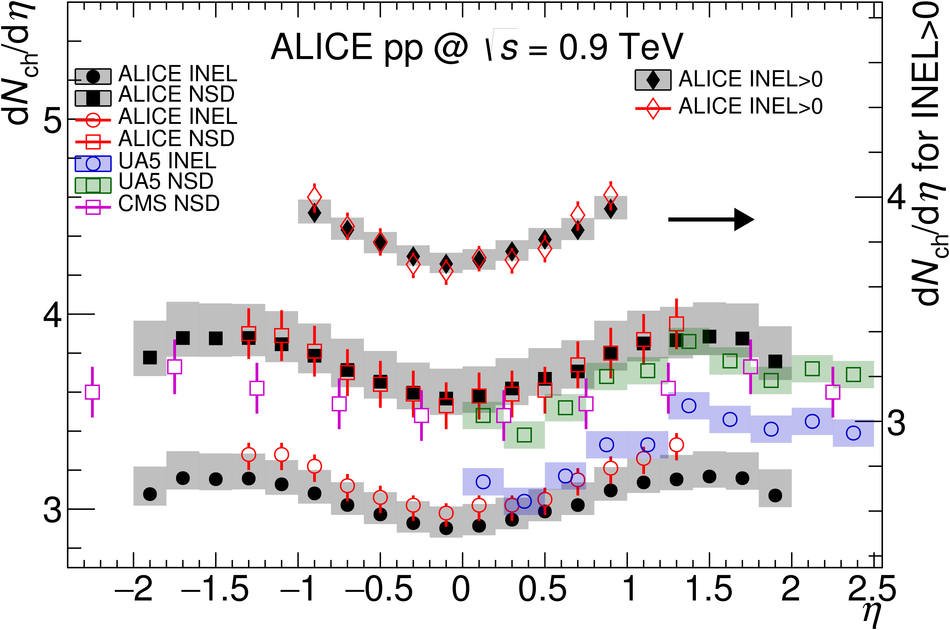 |