Centre-of-mass energy dependence of the $q$-moments ($q =$ 2 to 4, left-hand scale, and $q = 5$, right-hand scale) of the multiplicity distributions for NSD events in three different pseudorapidity intervals ($|\eta| < 1.5$ top, $|\eta| < 1.0$ middle and $|\eta| < 0.5$ bottom). ALICE data (black) are compared to UA5 (red) for $|\eta| < 0.5$ and $|\eta| < 1$, at $\sqrt{s} = 0.9$ TeV, and with CMS (blue) at $\sqrt{s} =$ 0.9 and 7 TeV for $|\eta| < 0.5$. The error bars represent the combined statistical and systematic uncertainties. The data at 0.9 and 7 TeV are slightly displaced horizontally for visibility. | 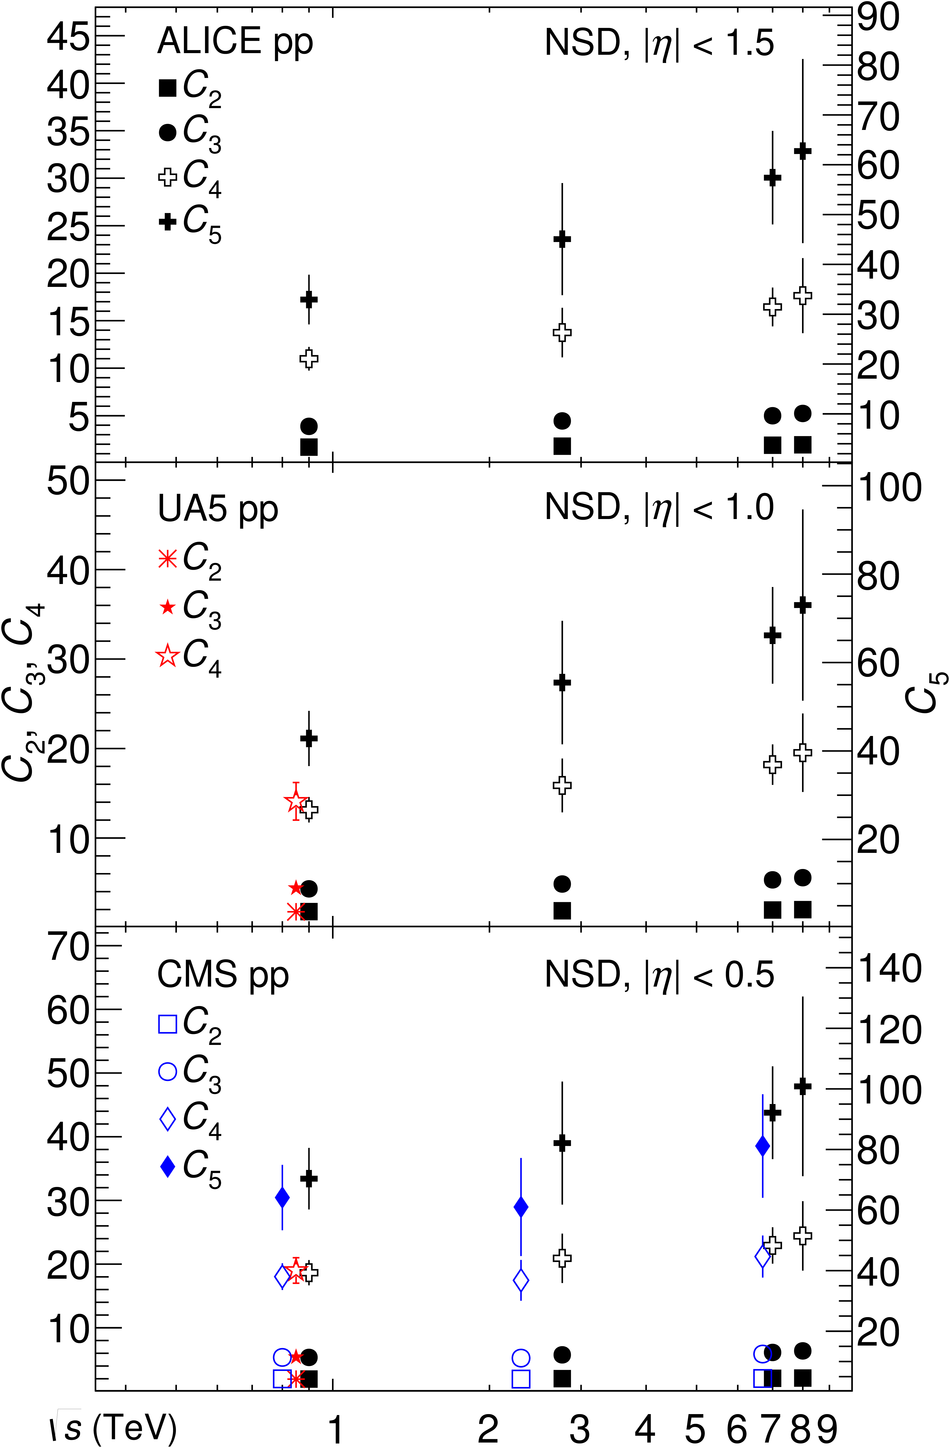 |