Comparison of the $\RAA$ measurements with the ${\it MC@sHQ+EPOS2}$ model [5] including radiative and collisional
interactions (left) and with the ${\it TAMU elastic}$ model [6] including collisional interactions via in-medium resonance formation.
For both models, results for the case in which the b quark interactions are calculated using the c quark mass are shown as well [7].
In the right-hand panel, the band between lines with the same style represents the theoretical uncertainty. This figure updates Fig. 5 | 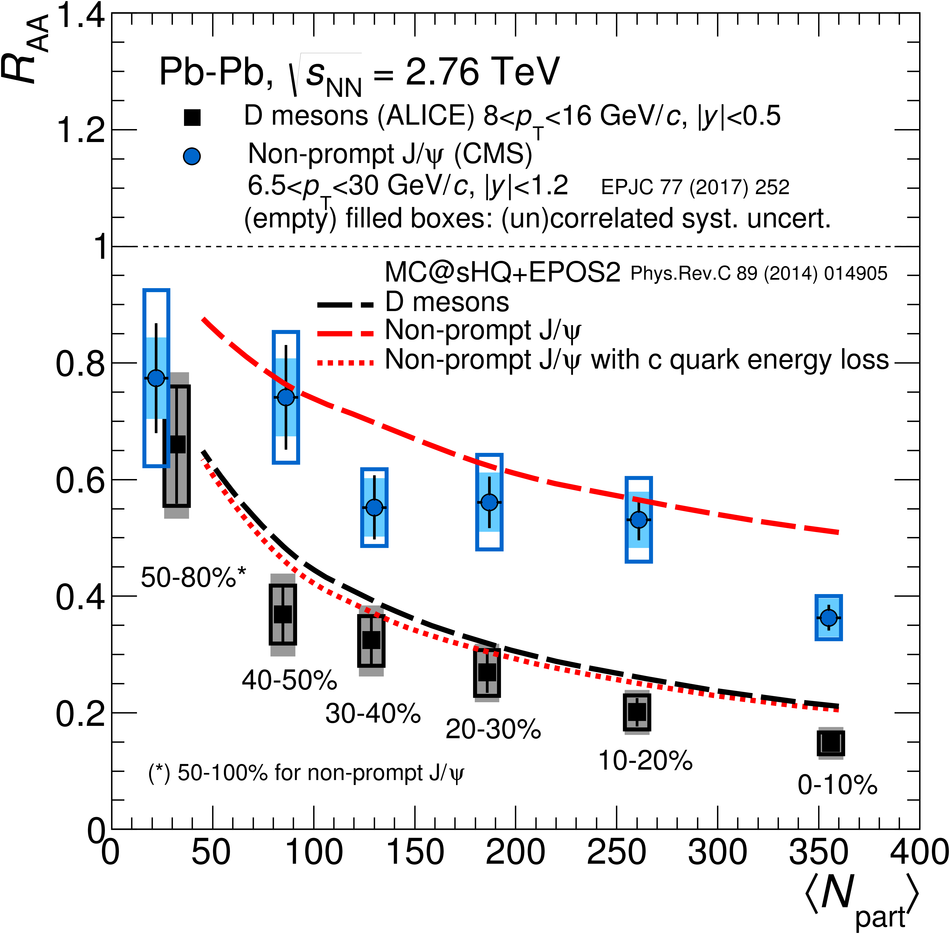 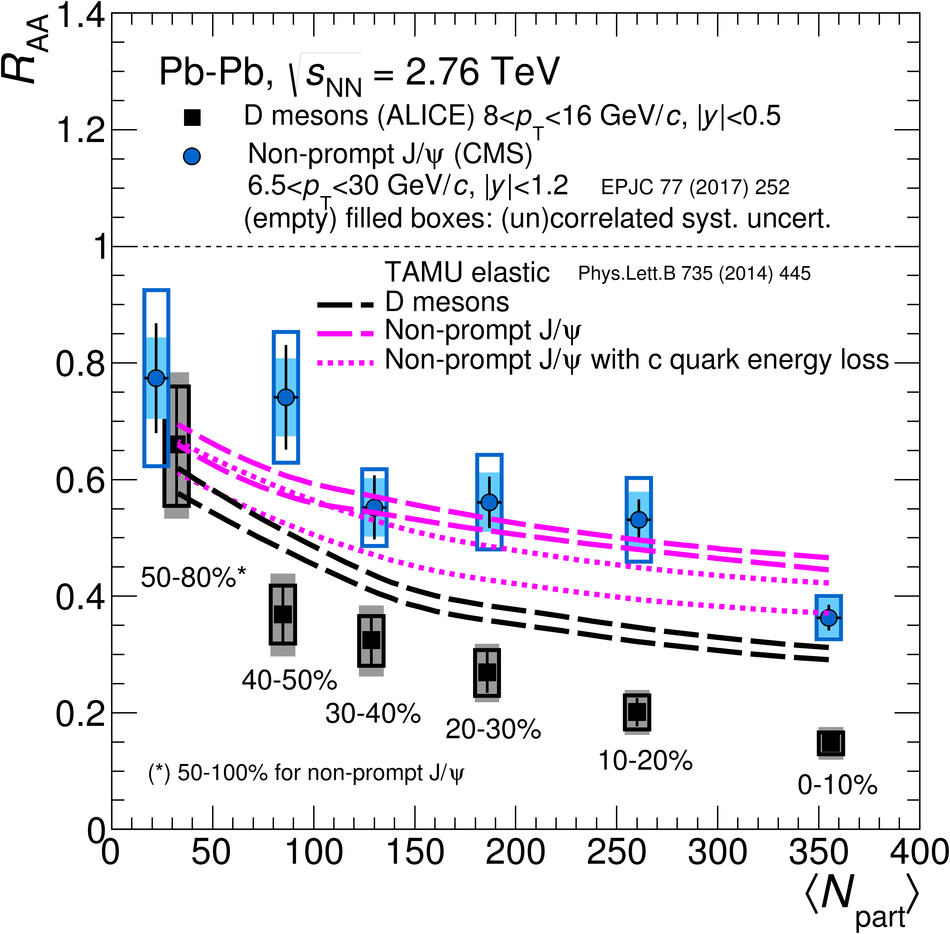 |