Response matrices obtained propagating Monte Carlo generated events, in this case with the PYTHIA ATLAS-CSC flat tune for the non-single-diffractive event class selection. Left: Matrix including the overlap region between SPD and FMD. Right: Matrix for the region where the majority of the counts are from the FMD. The diagonal (generated=reconstructed) is plotted as a black dotted line. | 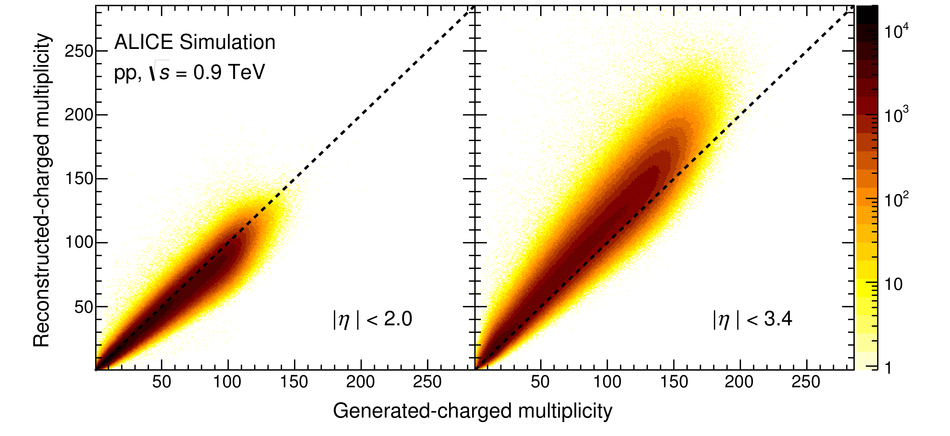 |