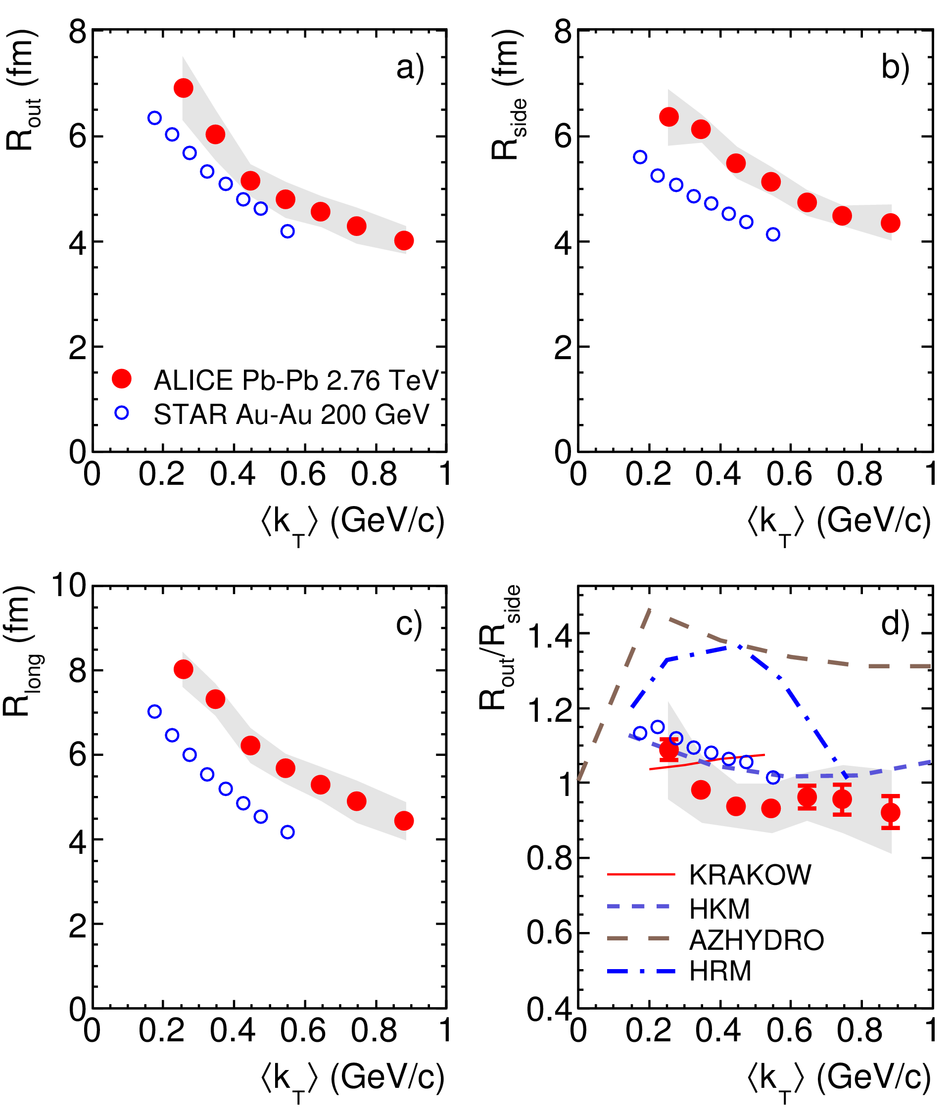
Pion HBT radii for the 5% most central Pb-Pb collisions at $\sqrt{s_{\rm NN}}=2.76 $TeV, as function of $\langle$$k_T$$\rangle$ (red filled dots). The shaded bands represent the systematic errors. For comparison, parameters for Au--Au collisions at $\sqrt{s}$ =200 GeV are shown as blue open circles (The combined, statistical and systematic, errors on these measurements are below 4%.)The lines show model predictions (see text). |  |