$v_1\{GF\}$ (left) and $v_2\{GF\}$ (right) as obtained using restricted ${p_{T}^{a}}$ fit ranges at two different centralities. The open circles (solid squares) represent fits using only $0.25 < {p_{T}^{a}} < 1$ ($2 < {p_{T}^{a}} < 4$) GeV/$c$. For the more central $v_2$ points, the two different fit ranges lead to a similar curve, indicating an approximate factorization. In contrast, a divergence with rising ${p_{T}^{t}}$ is observed for $v_1\{GF\}$. For both $n=1$ and $n=2$, the divergence is enhanced in more peripheral centrality classes. | 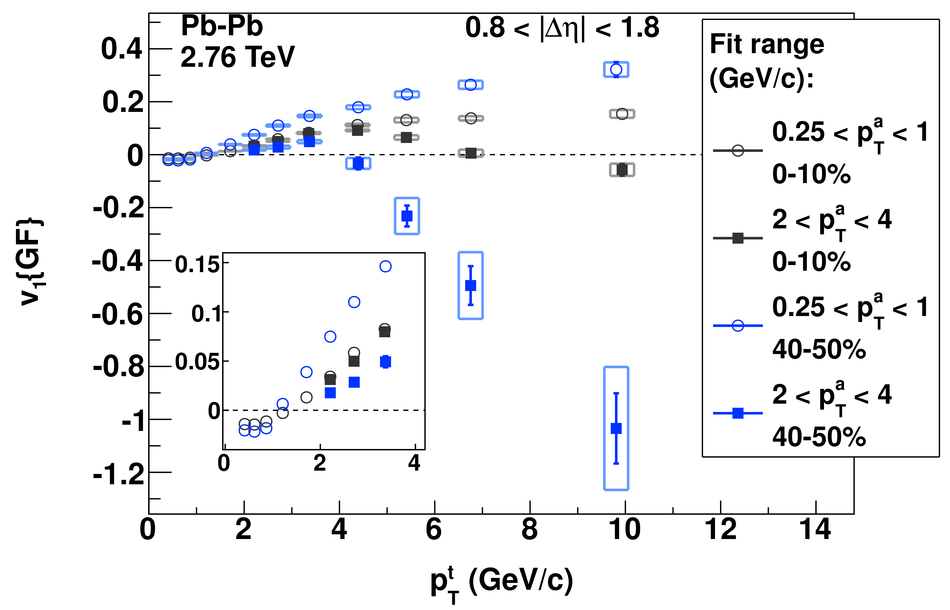 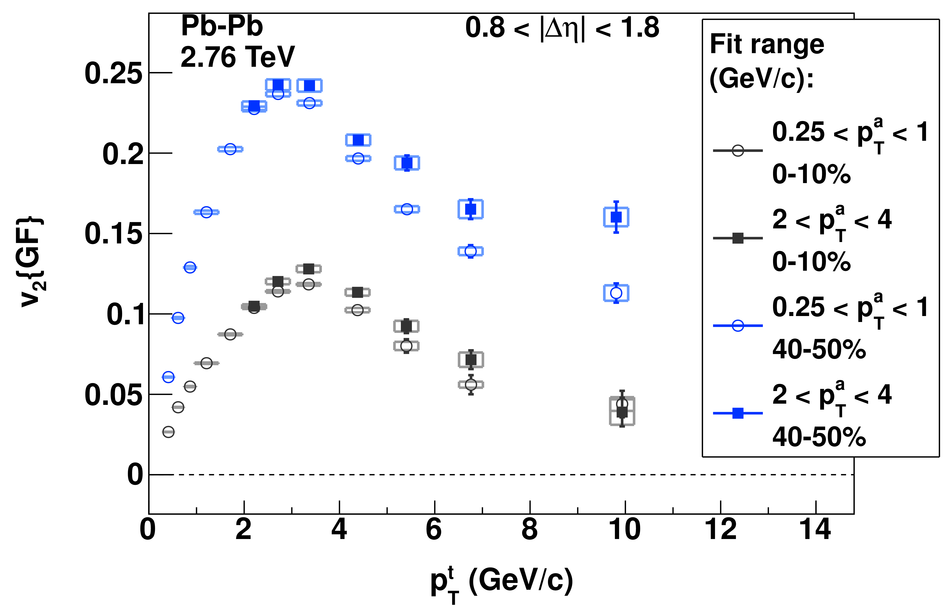 |