Comparison of $R_{AA}$ in central Pb-Pb collisions at LHC to measurements at $\sqrt{s_{_{ NN}}}=200$ GeV by the PHENIX [30] and STAR [31] experiments at RHIC. The error representation of the ALICE data is as in Fig.3. The statistical and systematic errors of the PHENIX data are shown as error bars and boxes, respectively The statistical and systematic errors of the STAR data are combined and shown as boxes. The vertical bars around $R_{AA} = 1$ indicate the $p_T$ independent scaling errors on $R_{AA}$. | 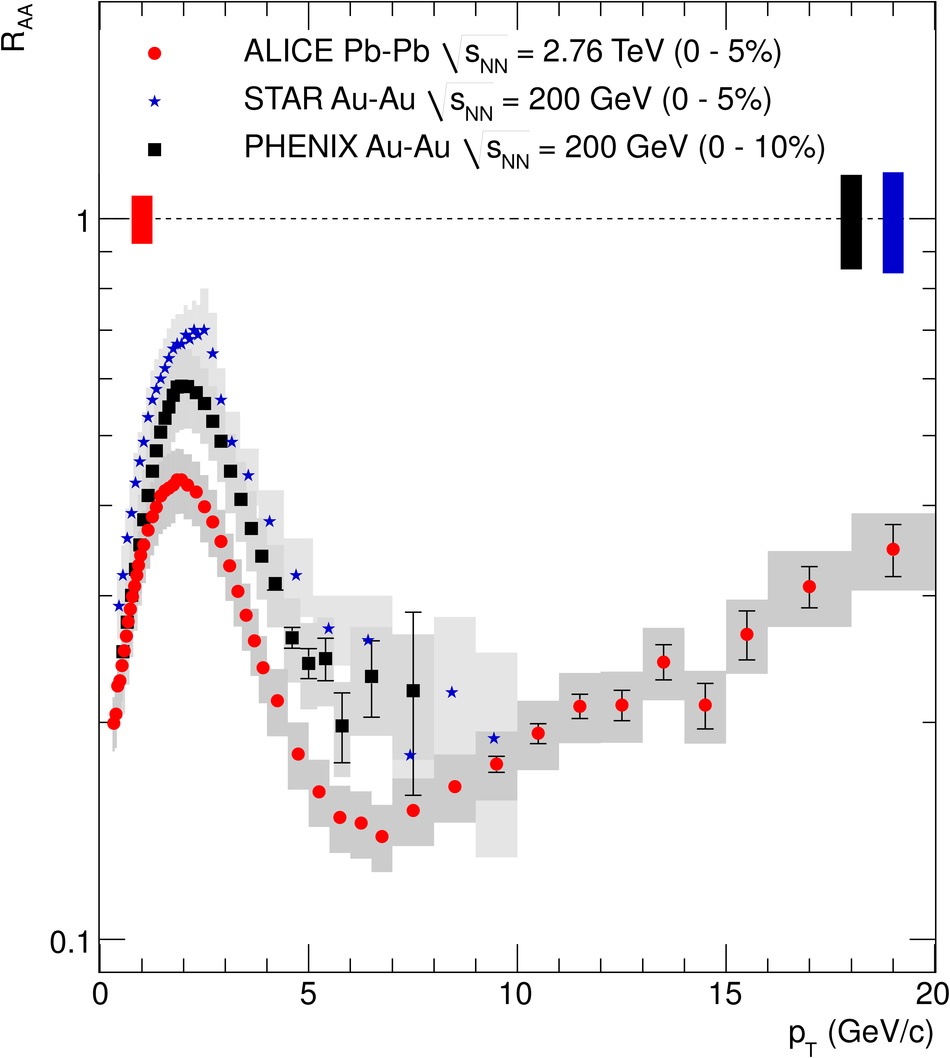 |