We report measurements of the production of prompt D$^0$, D$^+$, D$^{*+}$ and D$^+_{\rm s}$ mesons in Pb-Pb collisions at the centre-of-mass energy per nucleon-nucleon pair $\sqrt{s_{\rm NN}}=5.02$ TeV, in the centrality classes 0-10%, 30-50% and 60-80%. The D-meson production yields are measured at mid-rapidity ($|y|<~0.5$) as a function of transverse momentum ($p_{\rm T}$). The $p_{\rm T}$ intervals covered in central collisions are: $1<~p_{\rm T}<~50$ Gev/$c$ for D$^0$, $2<~p_{\rm T}<~50$ GeV/$c$ for D$^+$, $3<~p_{\rm T}<~50$ GeV/$c$ for D$^{*+}$, and $4<~p_{\rm T}<~16$ GeV/$c$ for D$^+_{\rm s}$ mesons. The nuclear modification factors ($R_{\rm AA}$) for non-strange D mesons (D$^0$, D$^+$, D$^{*+}$) show minimum values of about 0.2 for $p_{\rm T}$ = 6-10 GeV/$c$ in the most central collisions and are compatible within uncertainties with those measured at $\sqrt{s_{\rm NN}}=2.76$ TeV. For D$^+_{\rm s}$ mesons, the values of $R_{\rm AA}$ are larger than those of non-strange D mesons, but compatible within uncertainties. In central collisions the average $R_{\rm AA}$ of non-strange D mesons is compatible with that of charged particles for $p_{\rm T} > 8$ GeV/$c$, while it is larger at lower $p_{\rm T}$. The nuclear modification factors for strange and non-strange D mesons are also compared to theoretical models with different implementations of in-medium energy loss.
JHEP 1810 (2018) 174
HEP Data
e-Print: arXiv:1804.09083 | PDF | inSPIRE
CERN-EP-2018-066
Figure 1
Invariant-mass distributions for the four D-meson species in selected $\pt$ intervals for the centrality class 0--10\%. Fitted values for the meson mass $\mu$, width $\sigma$ and raw yield $S$ are also given. Top row: $\Dzero$ mesons with $1< \pt< 2 \gev/c$, before (left) and after (right) subtraction of the background fit function. For this $\pt$ interval, the width of the Gaussian used to describe the signal is fixed to the value obtained in the simulations Middle row: $\Dplus$ mesons with $8< \pt< 10 \gev/c$ and $\Dstar$ mesons (difference of $M({\rm K}\pi\pi)$ and $M({\rm K}\pi)$) with $24< \pt< 36 \gev/c$ Bottom row: $\Ds$ mesons with $4< \pt< 6 \gev/c$ and $12< \pt< 16 \gev/c$; the $\rm \Dplus\to K^+K^-\pi^+$ signal is visible on the left of the $\Ds$ signal. | 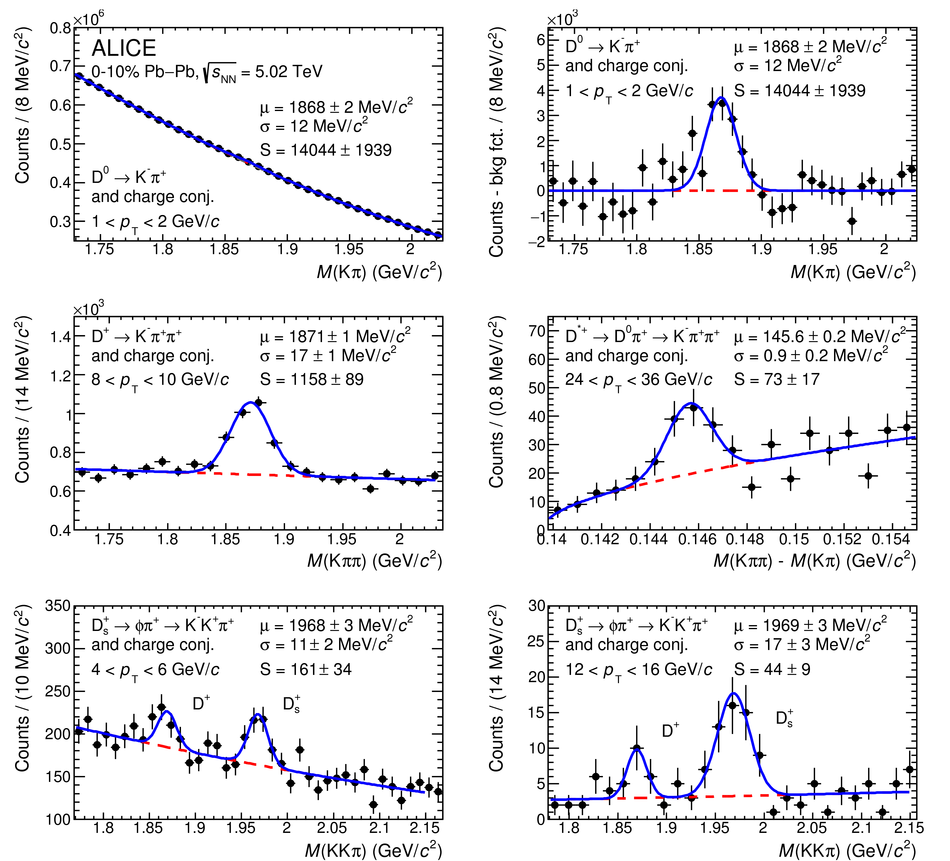 |
Figure 3
Transverse momentum distributions $\d N/\d\pt$ of prompt $\Dzero$ (a), $\Dplus$ (b), $\Dstar$ (c) and $\Ds$ (d) mesons in the 0--10\%, 30--50\% and 60--80\% centrality classes in $\PbPb$ collisions at $\sqrtsNN=5.02 \tev$. Statistical uncertainties (bars) and systematic uncertainties (boxes) are shown. The uncertainty on the branching ratios is quoted separately Horizontal bars represent bin widths, symbols are placed at the centre of the bin. | 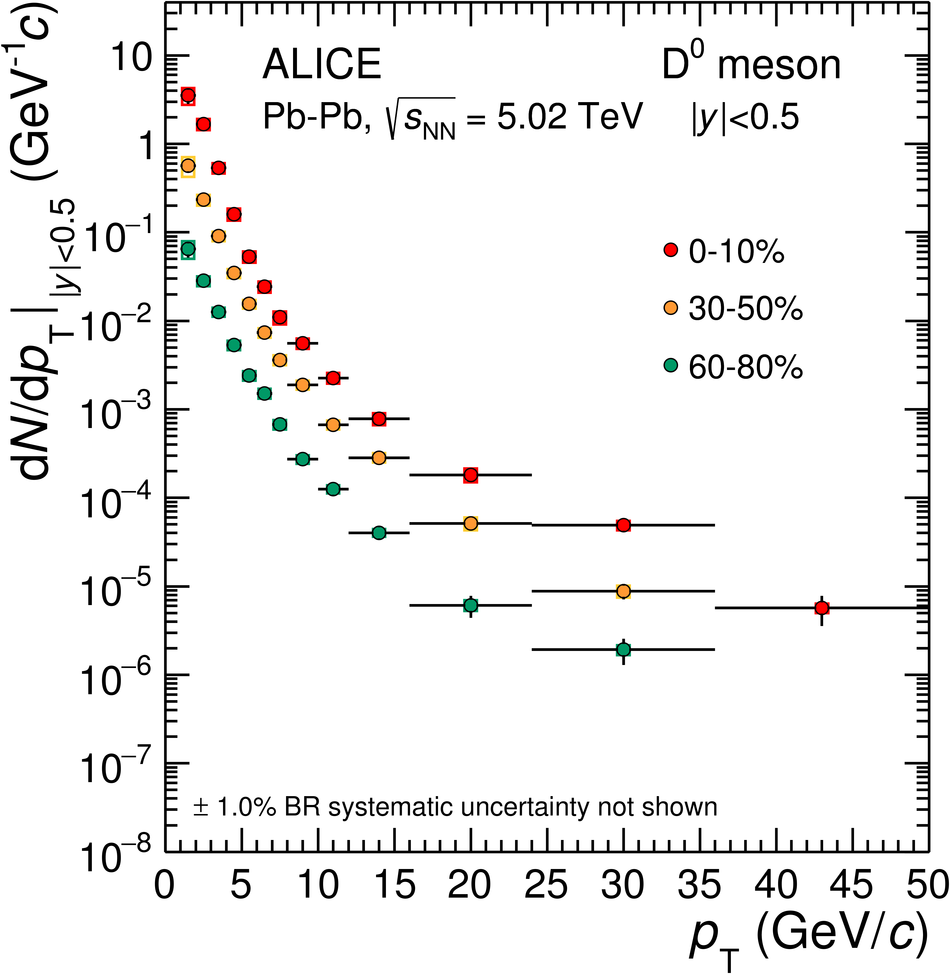 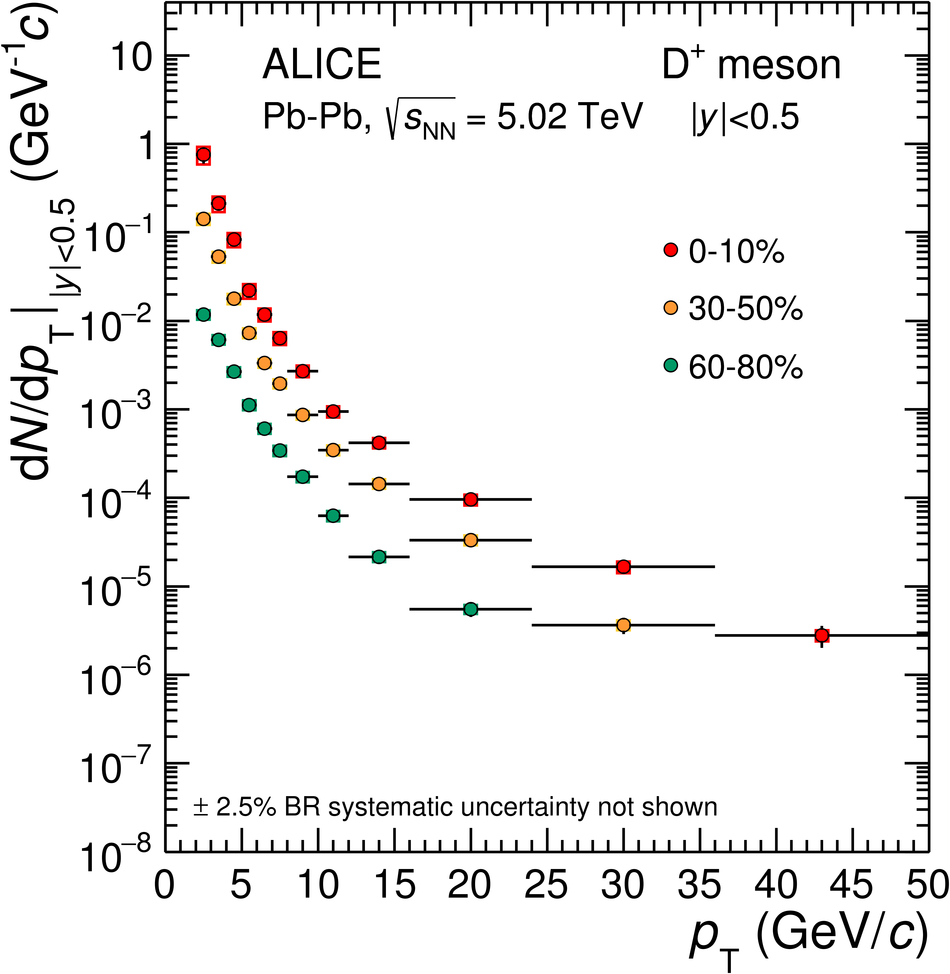 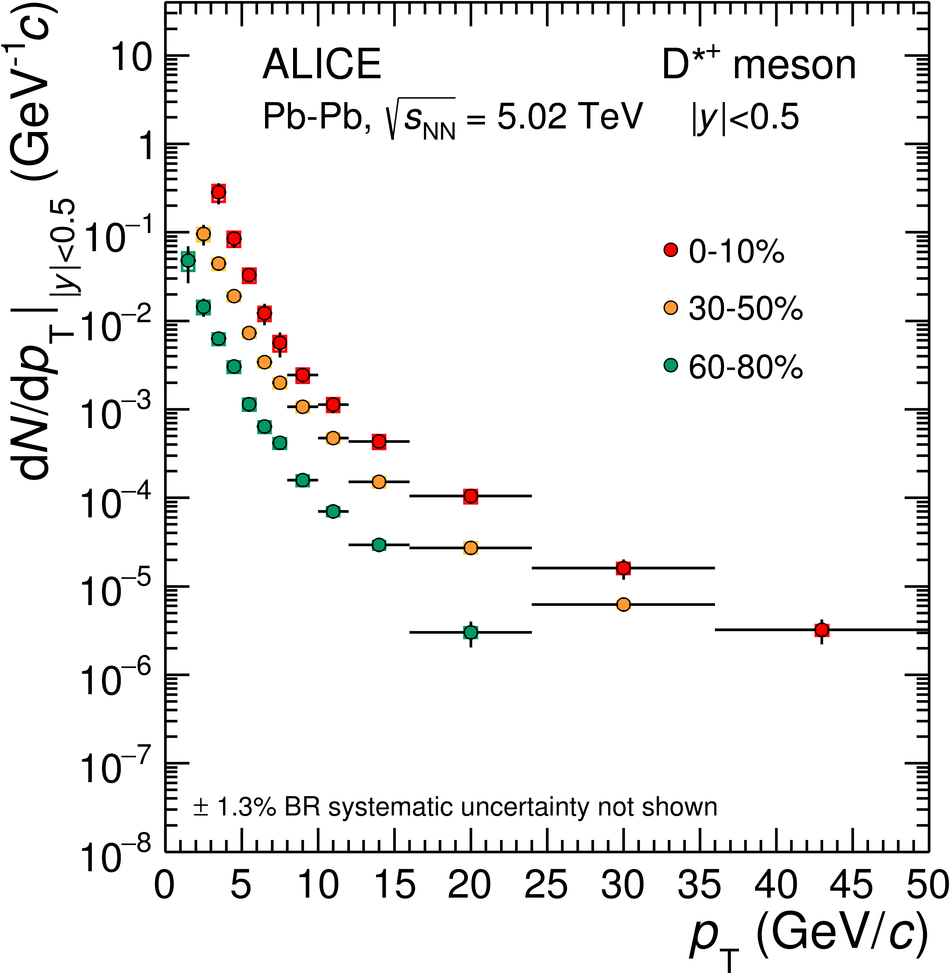  |

Figure 5
$\RAA$ of prompt $\Dzero$, $\Dplus$ and $\Dstar$ mesons (left-hand panels) and of prompt $\Ds$ mesons compared with the average $\RAA$ of the non-strange D-meson states available in each $\pt$ interval (right-hand panels) for the 0--10\%, 30--50\% and 60--80\% centrality classes. Statistical (bars), systematic (empty boxes), and normalisation (shaded box around unity) uncertainties are shown. Filled markers are obtained with the pp rescaled reference, empty markers with the $\pt$-rescaled reference. | 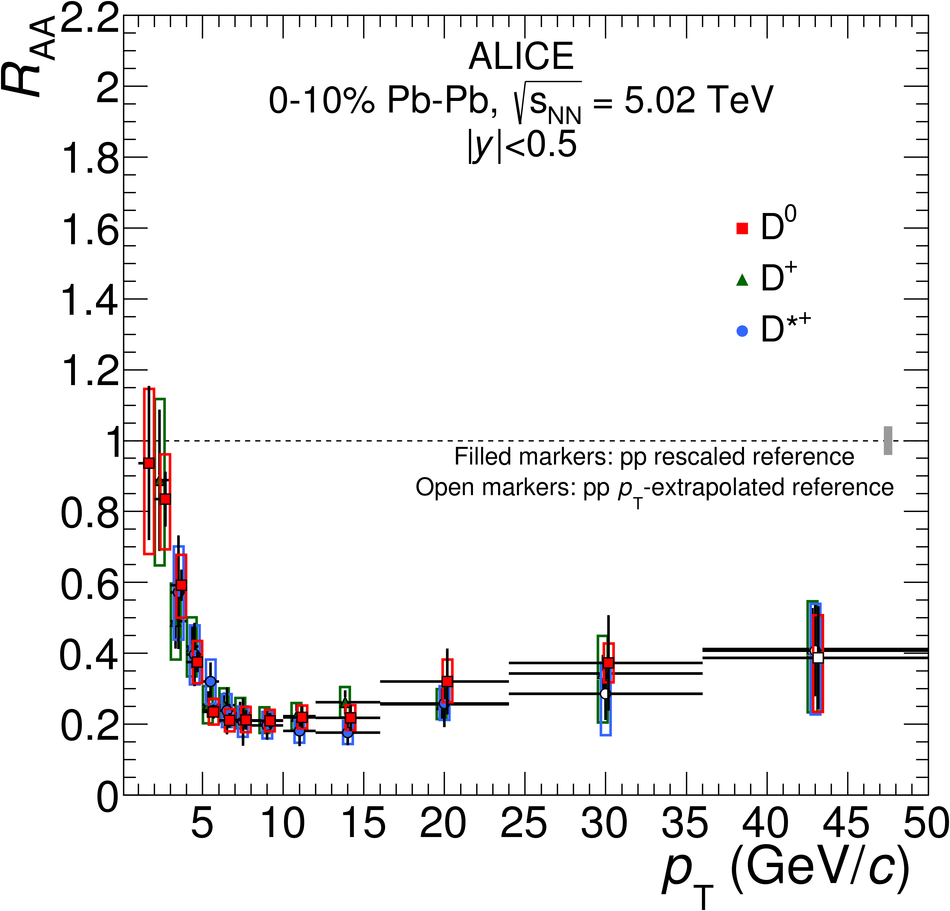 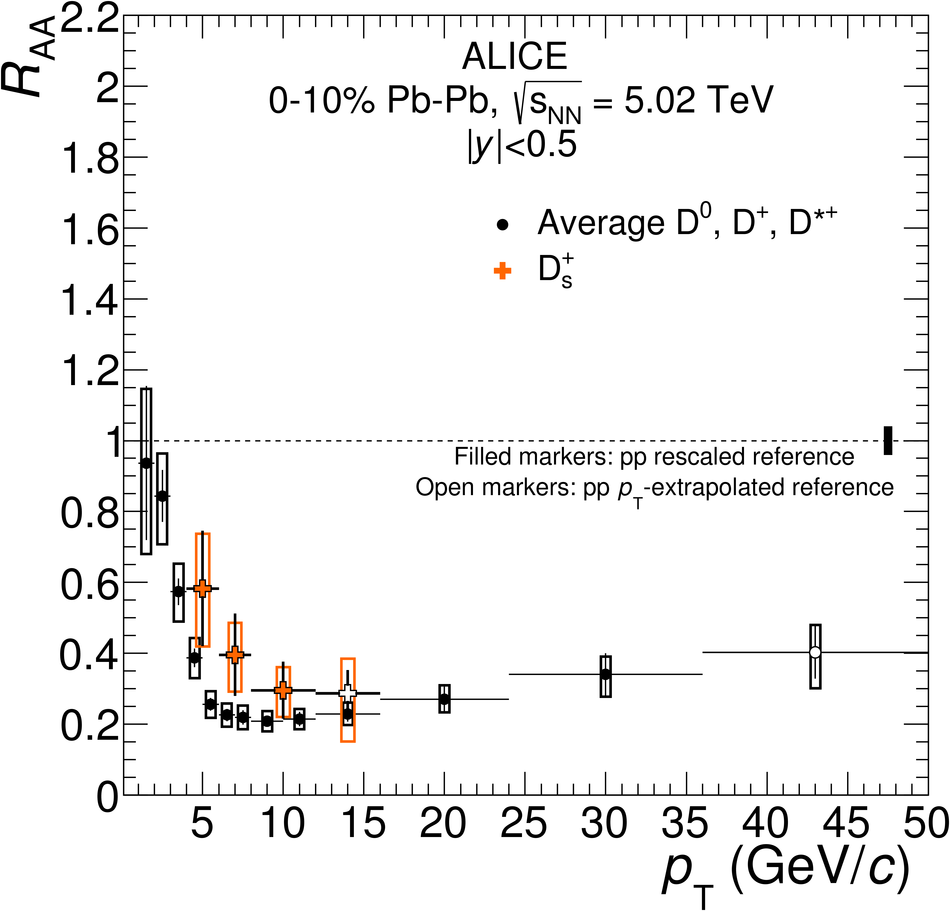  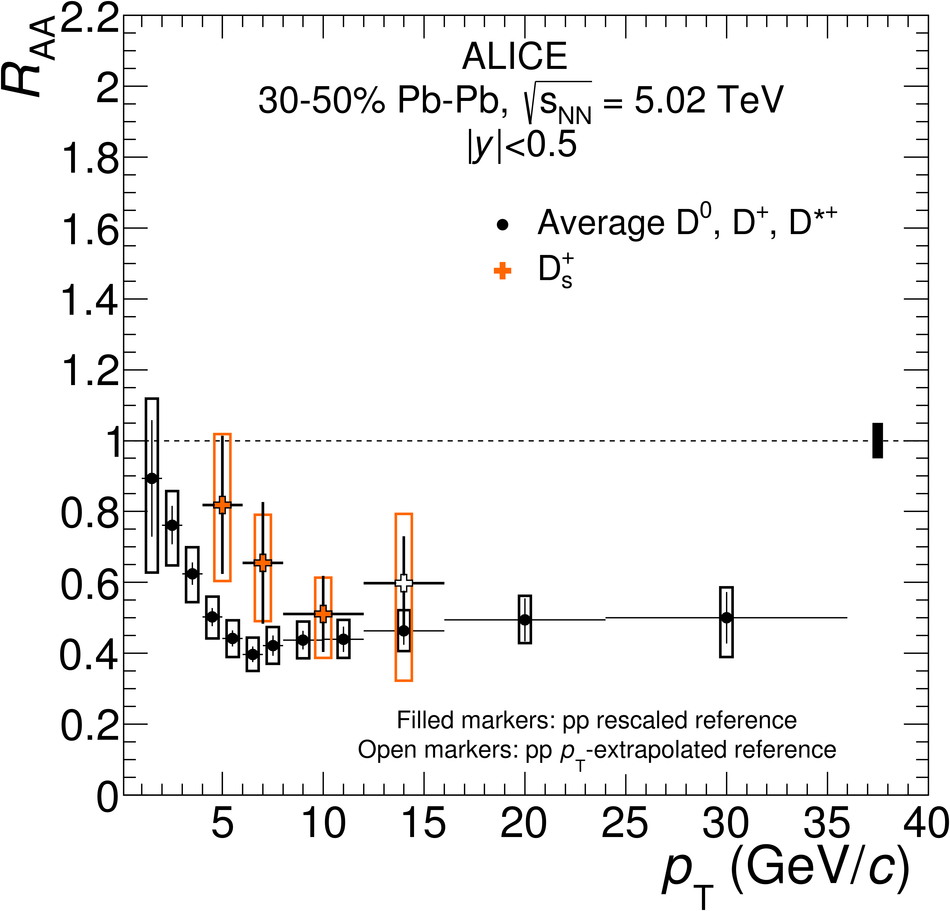 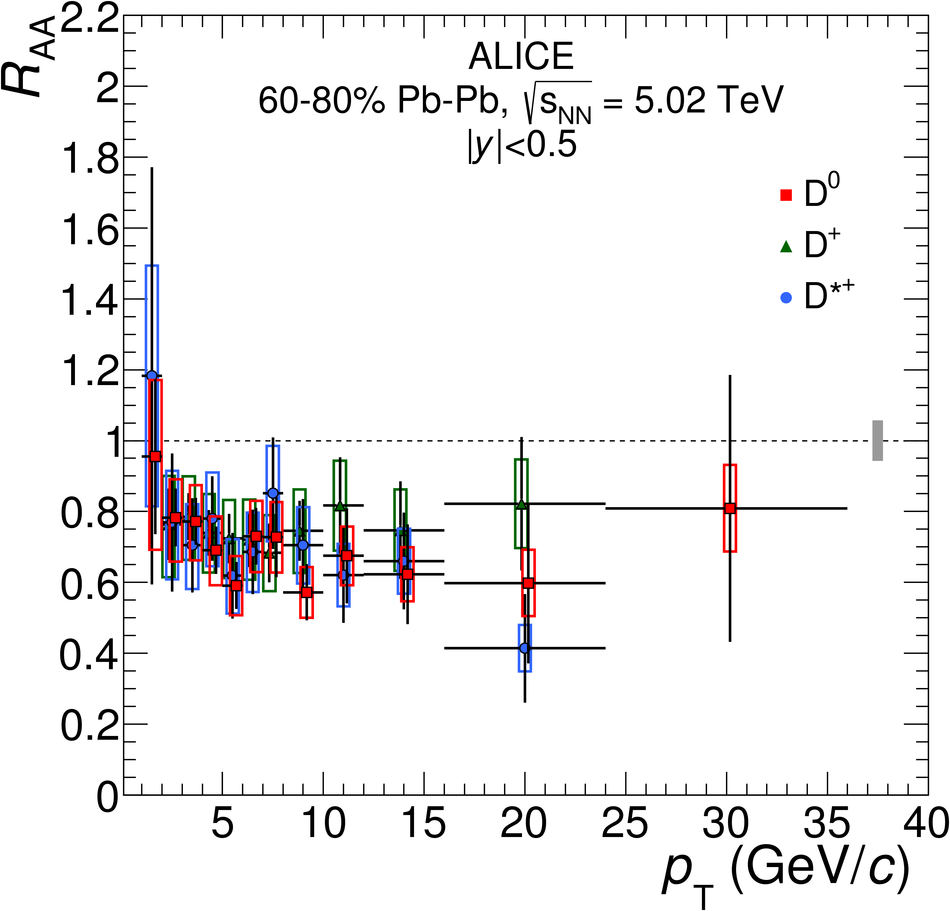 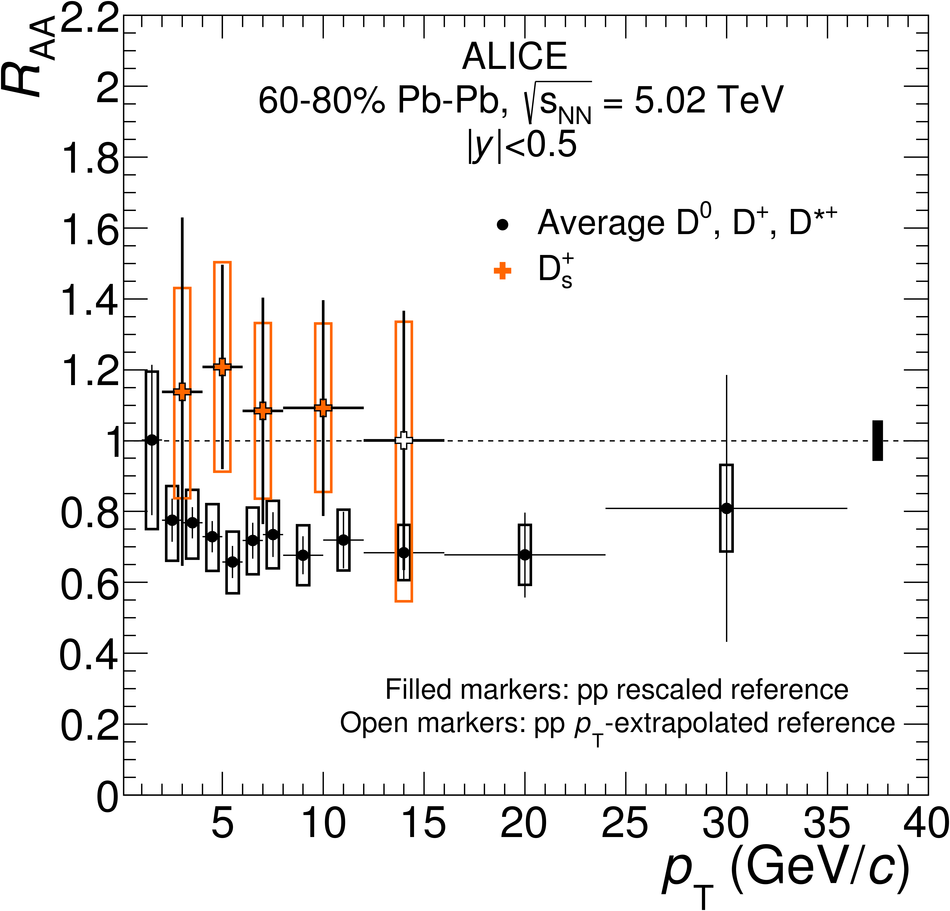 |
Figure 6
Left panel: average $\RAA$ of prompt $\Dzero$, $\Dplus$ and $\Dstar$ mesons by ALICE compared to $\RAA$ of prompt $\Dzero$ mesons by CMS in the 0--10\% centrality class and at $\sqrtsNN= 5.02 \tev$. Statistical (bars), systematic (empty boxes), and normalisation (shaded box around unity) uncertainties are shown. Right panel: average $\RAA$ of $\Dzero$, $\Dplus$ and $\Dstar$ mesons compared with the Djordjevic model in the 0-10\% centrality class at two collision energies. Statistical (bars), systematic (empty boxes), and normalisation (shaded box) uncertainties are shown. |  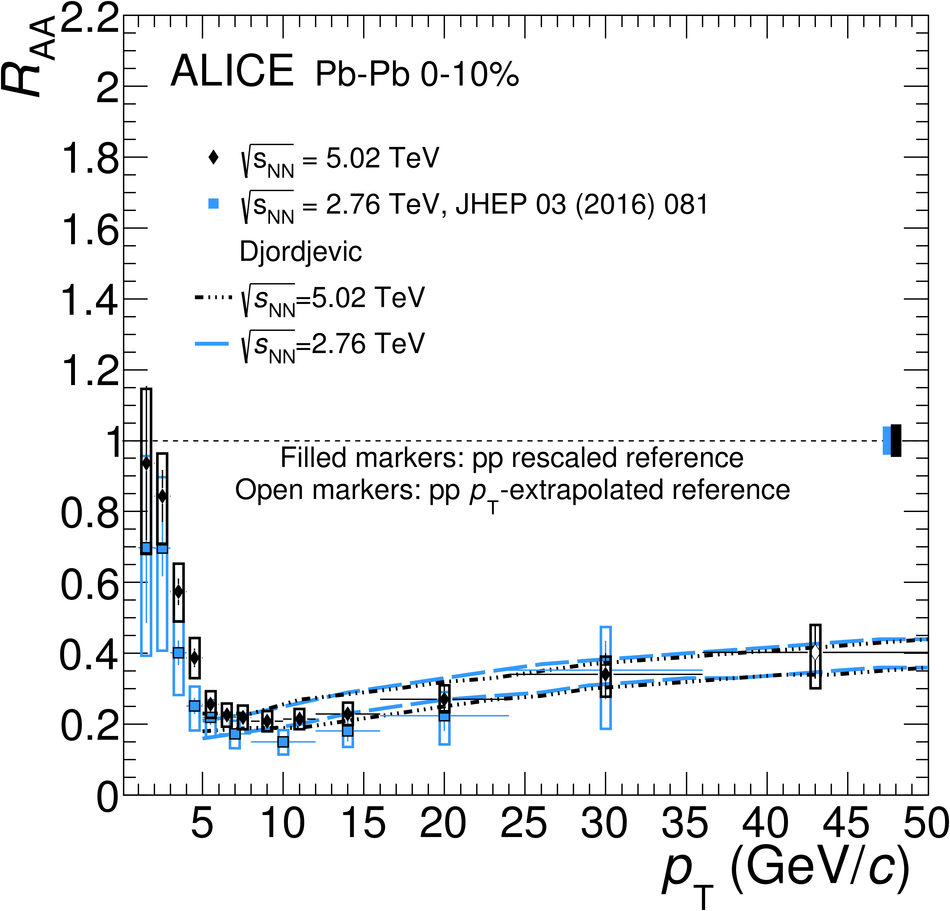 |
Figure 7
Average $\RAA$ of prompt $\Dzero$, $\Dplus$ and $\Dstar$ mesons in the 0--10\% (left), 30--50\% (middle) and 60--80\% (right) centrality classes at $\sqrtsNN=5.02 \tev$ compared to the $\RAA$ of charged particles in the same centrality classes . The ratios of the $\RAA$ are shown in the bottom panels. Statistical (bars), systematic (empty boxes), and normalisation (shaded box around unity) uncertainties are shown. | 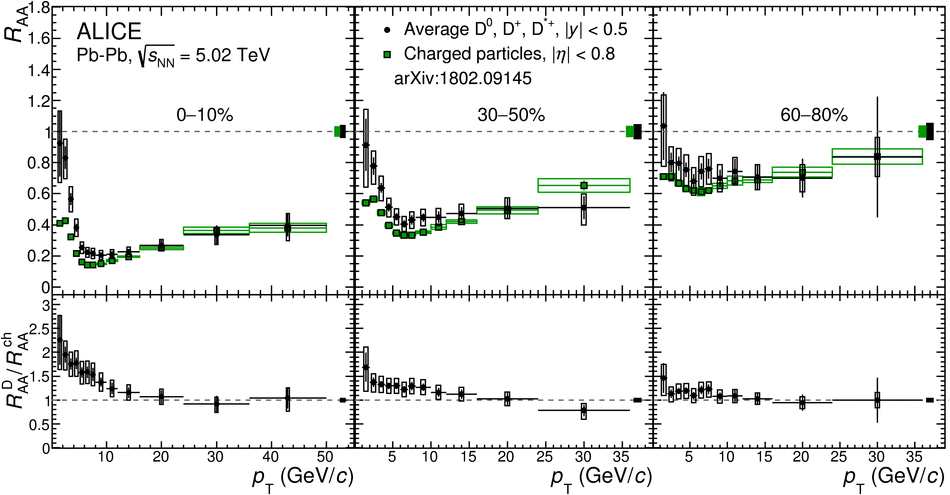 |
Figure 8
Average $\RAA$ of $\Dzero$, $\Dplus$ and $\Dstar$ mesons compared with model calculations. The three rows refer to the 0--10\%, 30--50\% and 60--80\% centrality classes. The left panels show models based on heavy-quark transport, while the right panels show models based on pQCD energy loss. Model nomenclature and references:BAMPS , CUJET3.0 ,Djordjevic ,LBT ,MC@sHQ+EPOS2 ,PHSD POWLANG , SCET ,TAMU Some of the models are presented with two lines with the same style and colour, which encompass the model uncertainty band. | 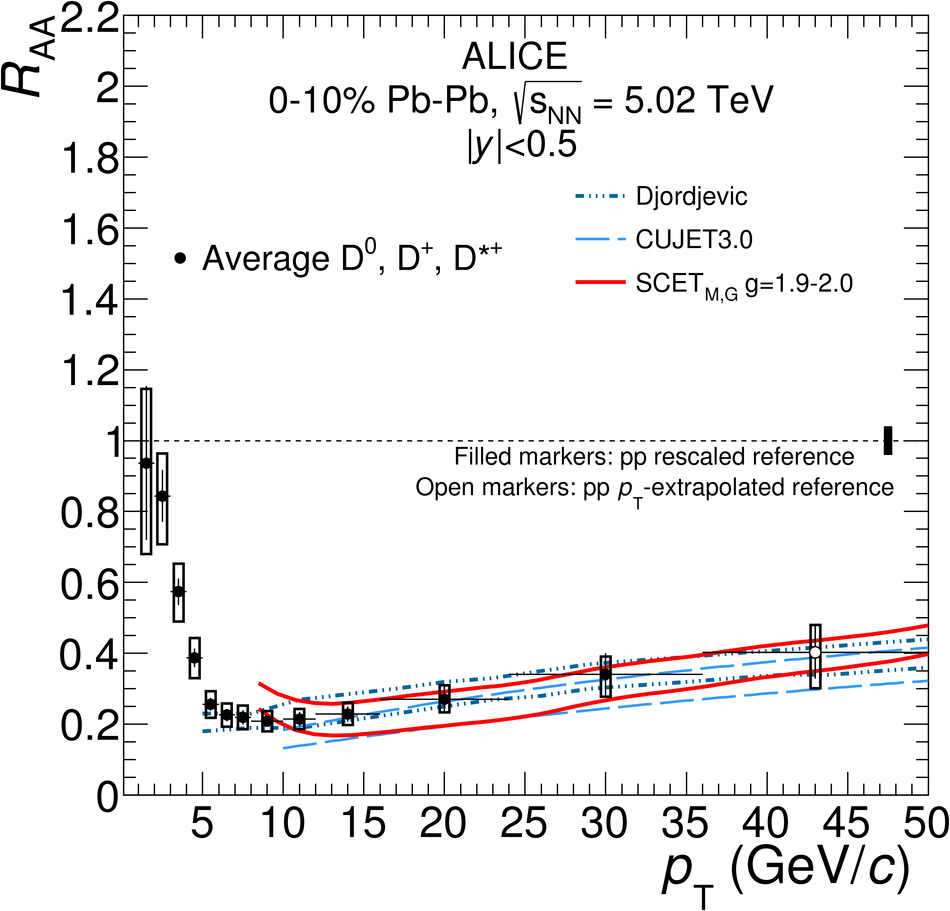 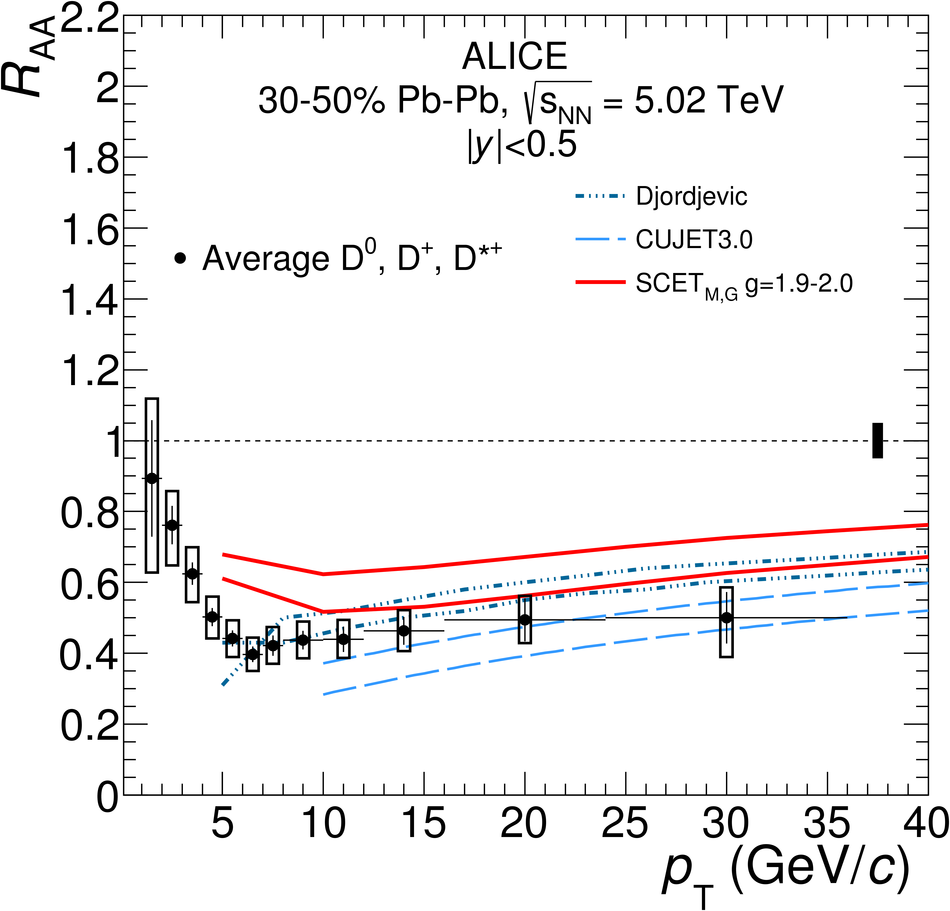 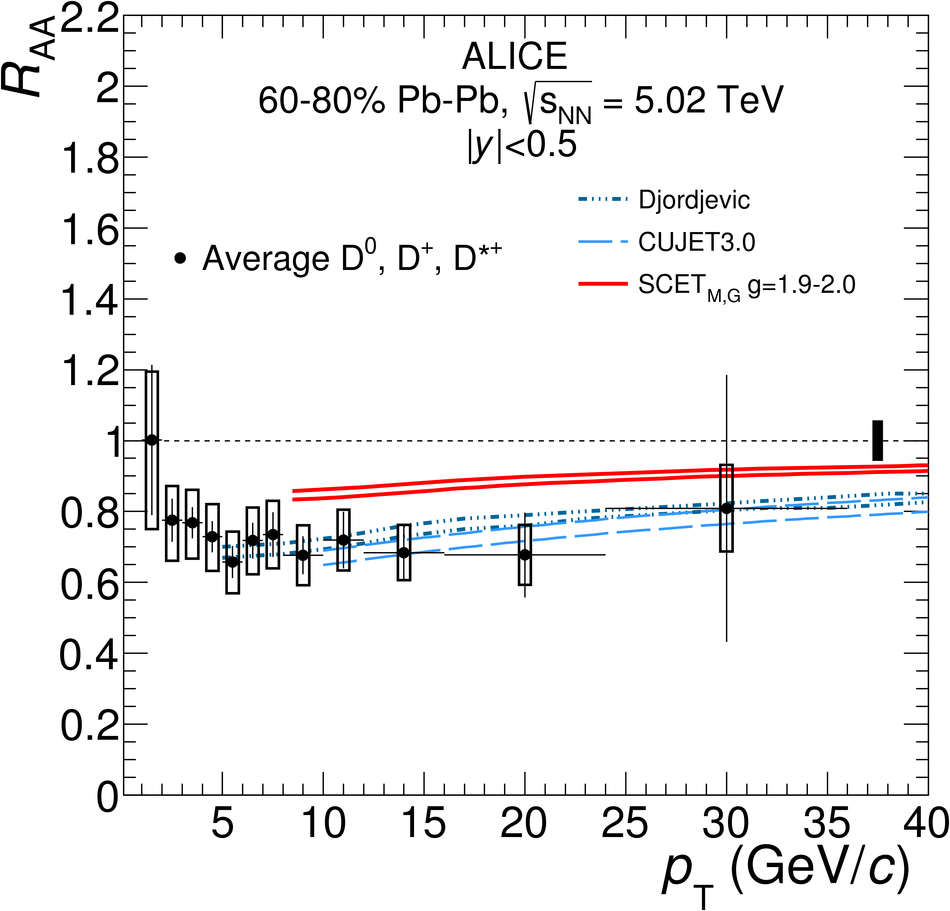 |


![[png]](https://alice-publications.web.cern.ch/sites/default/files/papers/4251/DmesonAverage_010_transport_Models_-90611.png)
![[png]](https://alice-publications.web.cern.ch/sites/default/files/papers/4251/DmesonAverage_3050_transport_Models_-90615.png)
![[png]](https://alice-publications.web.cern.ch/sites/default/files/papers/4251/DmesonAverage_6080_transport_Models_-90619.png)