We report on the first femtoscopic measurement of baryon pairs, such as p-p, p-$\Lambda$ and $\Lambda$-$\Lambda$, measured by ALICE at the Large Hadron Collider (LHC) in proton-proton collisions at $\sqrt{s}$ = 7 TeV. This study demonstrates the feasibility of such measurements in pp collisions at ultrarelativistic energies. The femtoscopy method is employed to constrain the hyperon-nucleon and hyperon-hyperon interactions, which are still rather poorly understood. A new method to evaluate the influence of residual correlations induced by the decays of resonances and experimental impurities is hereby presented. The p-p, p-$\Lambda$ and $\Lambda$-$\Lambda$ correlation functions were fitted simultaneously with the help of a new tool developed specifically for the femtoscopy analysis in small colliding systems 'Correlation Analysis Tool using the Schr\"odinger Equation' (CATS). Within the assumption that in pp collisions the three particle pairs originate from a common source, its radius is found to be equal to $r_{0} = 1.125\pm0.018$ (stat) $^{+0.058}_{-0.035}$ (syst) fm. The sensitivity of the measured p-$\Lambda$ correlation is tested against different scattering parameters which are defined by the interaction among the two particles, but the statistics is not sufficient yet to discriminate among different models. The measurement of the $\Lambda$-$\Lambda$ correlation function constrains the phase space spanned by the effective range and scattering length of the strong interaction. Discrepancies between the measured scattering parameters and the resulting correlation functions at LHC and RHIC energies are discussed in the context of various models.
Phys. Rev. C 99, 024001
HEP Data
e-Print: arXiv:1805.12455 | PDF | inSPIRE


Figure 3
The \pP (a), \pL (b) and \LL (c) correlation function with a simultaneous fit with the NLO expansion (red line) for the scattering parameter of \pL \cite{Haidenbauer:2013oca}. The dashed line denotes the linear baseline. After the fit is performed the LO \cite{POLINDER2006244} parameter set (green curve) is plugged in for the \pL system and the scattering length obtained from \cite{Adamczyk:2014vca} for the \LL system (cyan curve). | 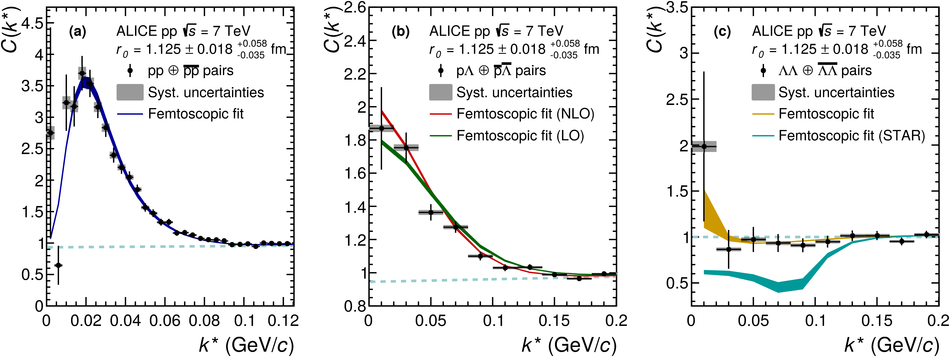 |
Figure 4
Number of standard deviations $n_{\sigma}$ of the modeled correlation function for a given set of scattering parameters (effective range $d_0$
and scattering length $f_0$)
with respect to the data, together with various model calculations \cite{ND, NF, NSC89, NSC97, ESC08, Ehime1, Ehime2, fss1, fss2, FG, HKMYY} and measurements \cite{Adamczyk:2014vca}. The gray shaded area corresponds to the region where the Lednick\'{y} model predicts a negative correlation function for \pp collisions at $\sqrt{s} = 7\,$TeV. | 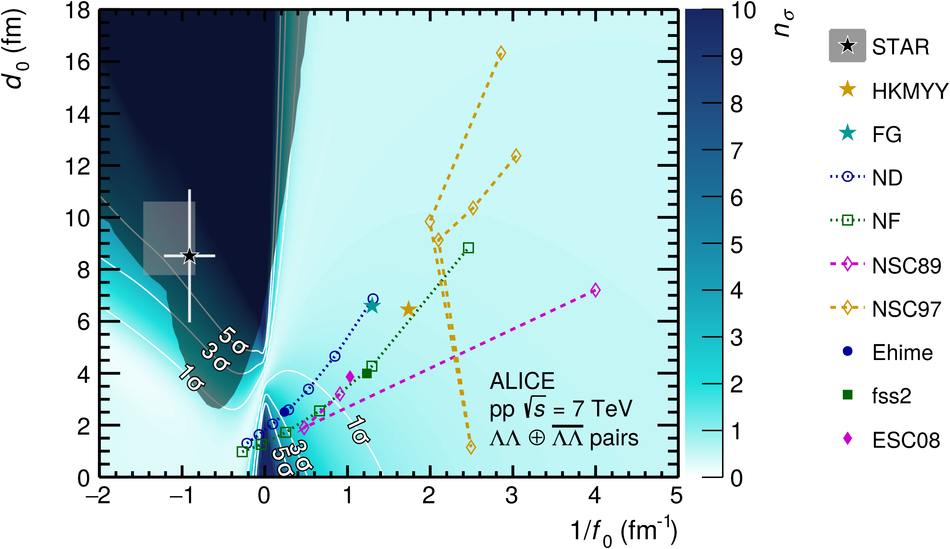 |
Figure 5
Comparison of radii obtained for different charged particle multiplicity intervals in the \pp collision system at $\sqrt{s}=7$\,TeV \cite{PhysRevD.84.112004,Abelev:2012sq, 2012151}. The error bars correspond to statistical and the shaded regions to the systematic uncertainties. The black point is the radius obtained in this analysis with \pP, \pL and \LL pairs, while the gray bar corresponds to the range of covered $m_{\mathrm{T}}$ in this analysis. | 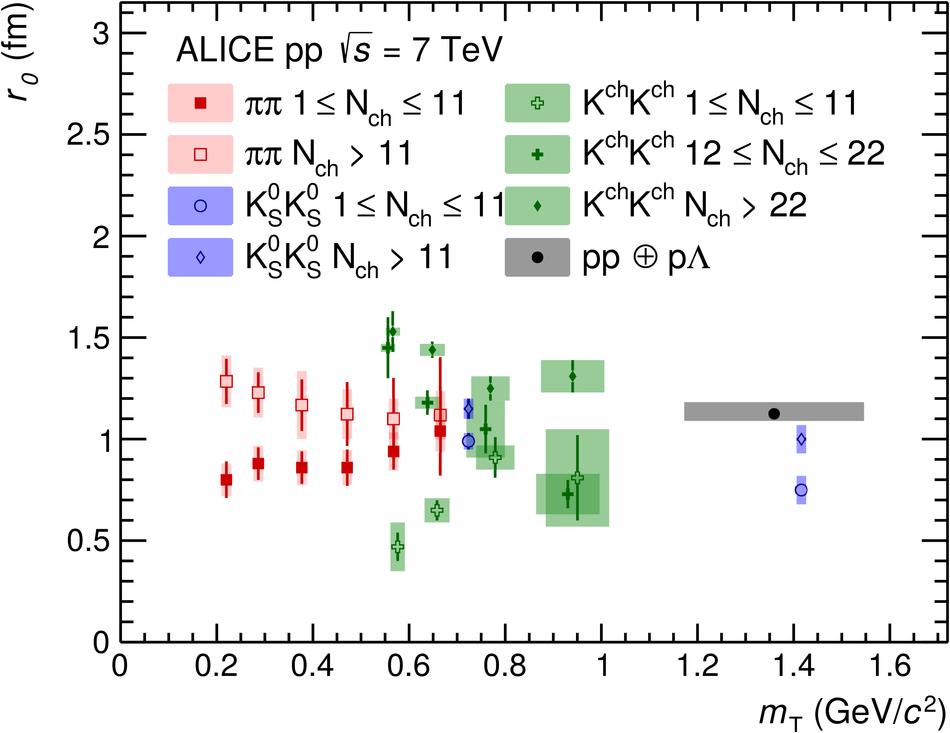 |