Spectator energy deposited in the ZDC calorimeters as a function of ZEM amplitude. The same correlation is shown for different centrality classes (5%, 10%, 20% and 30%) obtained by selecting specific VZERO amplitudes. The lines are a fit to the boundaries of the centrality classes with linear functions, where only the slope is fitted and the offset point is fixed (see text). | 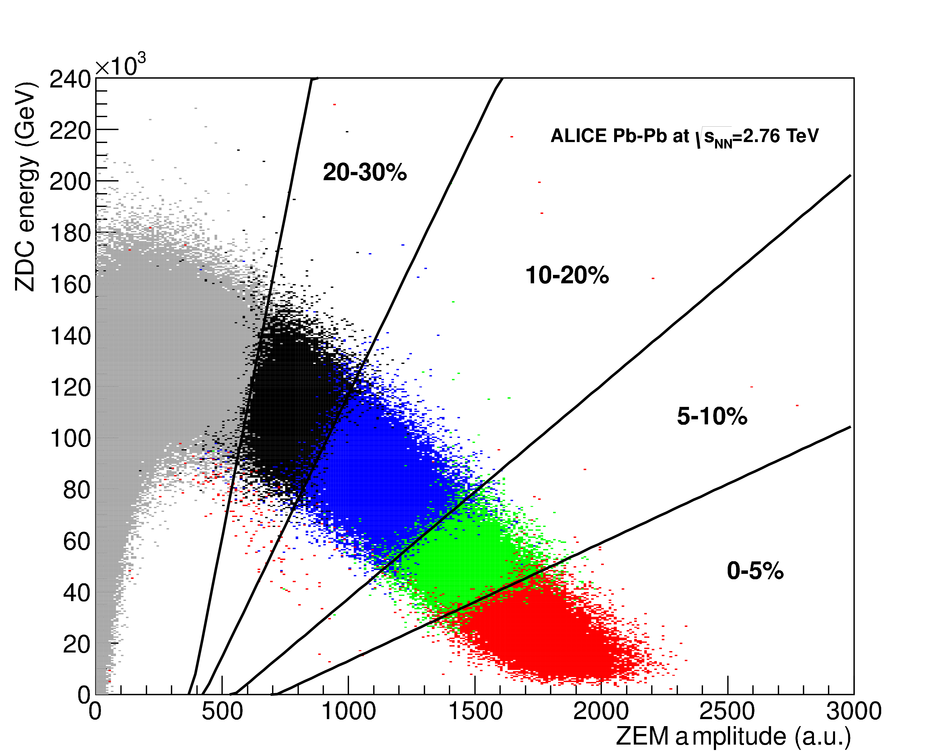 |