(a) Results of blast-wave fits, compared to similar fits at RHIC energies.
The uncertainty contours include the effect of the bin-by-bin systematic uncertainties, the dashed error bars represents the full systematic uncertainty (see text for details), the STAR contours include only statistical uncertainties.
(b) Comparison of fit results for different fit ranges; the error bars include only the effect of the bin-by-bin systematics (see text for details). | 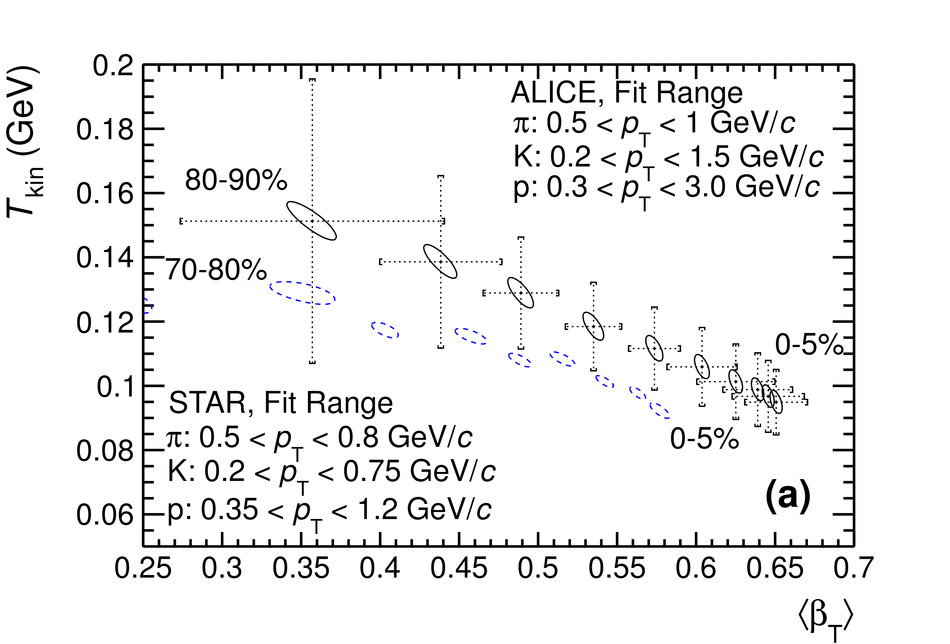 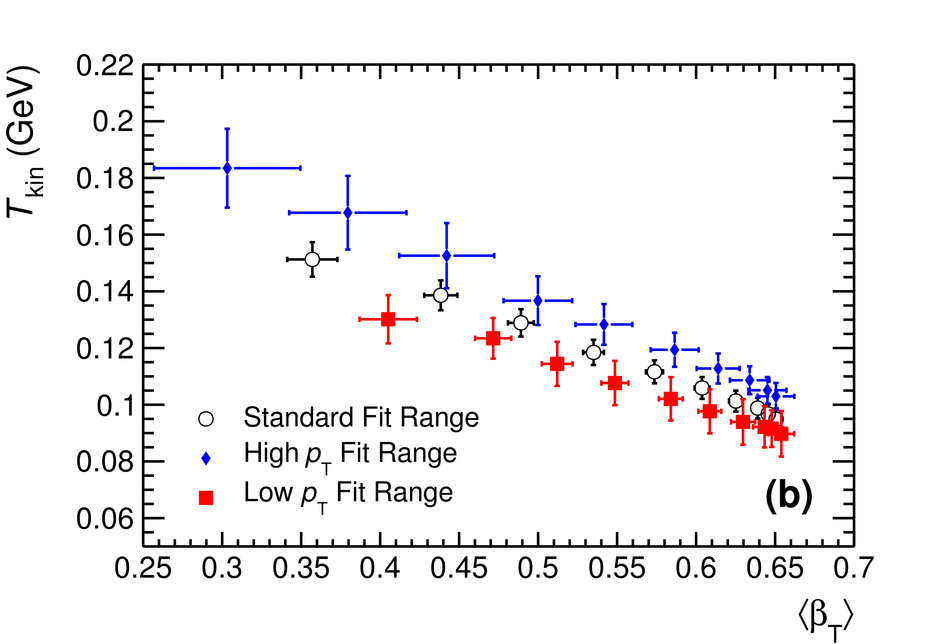 |