$\rm{d}E/\rm{d}x$ distributions measured for $|\eta| < 0.2$ and normalized to the integrated yields. The signals are fitted to a sum of four Gaussian functions (solid line). Two $p$ intervals are shown for central (left) and peripheral (center) Pb-Pb and pp (right) collisions. In all momentum intervals the electron fraction is below $1\%$ (not visible). Individual yields are shown as dashed curves; protons in blue (left), kaons in green, and pions in red (right). | 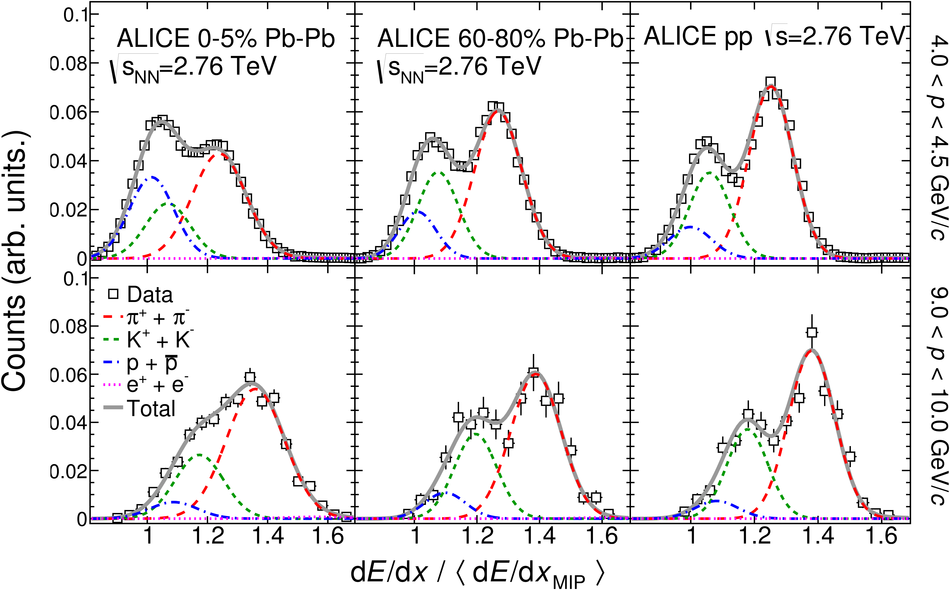 |