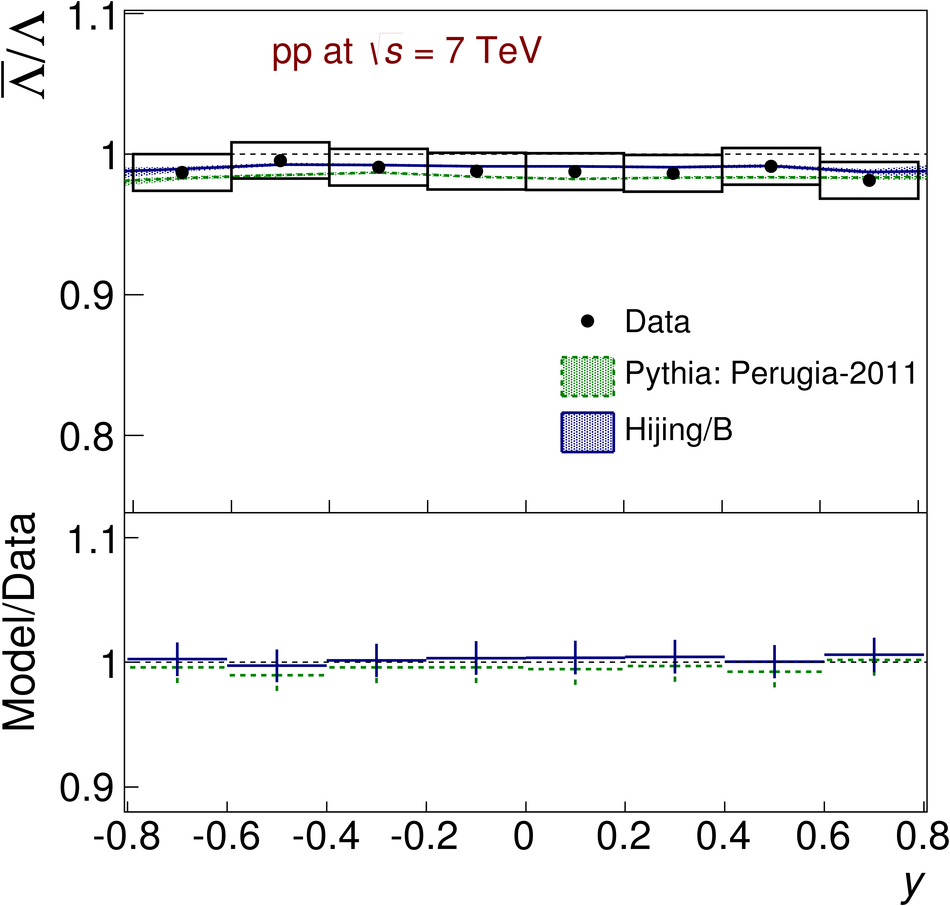
The $\rm{\overline{\Lambda}/\Lambda}$ ratio at $\sqrt{s} = 7$ TeV as a function of $\pt$ (left) and rapidity (right). The data points are compared with different Monte Carlo generators. The vertical bars (boxes) represent the statistical (systematic) uncertainty, while the horizontal bars represent the width of the rapidity or $\pt$ bin. Ratio of model to data is shown below using uncertainties added in quadrature. |  |