The inclusive production cross sections at forward rapidity of J/$\psi$, $\psi$(2S), $\Upsilon$(1S) and $\Upsilon$(2S) are measured in pp collisions at $\sqrt{s} = 7$ TeV with the ALICE detector at the LHC. The analysis is based in a data sample corresponding to an integrated luminosity of 1.35 pb$^{-1}$. Quarkonia are reconstructed in the dimuon-decay channel and the signal yields are evaluated by fitting the $\mu^+\mu^-$ invariant mass distributions. The differential production cross sections are measured as a function of the transverse momentum $p_{\rm T}$ and rapidity $y$, over the ranges $0 < p_{\rm T} < 20$ GeV/$c$ for J/$\psi$, $0 < p_{\rm T} < 12$ GeV/$c$ for all other resonances and for $2.5 < y < 4$. The measured cross sections integrated over $p_{\rm T}$ and $y$, and assuming unpolarized quarkonia, are: $\sigma_{J/\psi} = 6.69 \pm 0.04 \pm 0.63$ $\mu$b, $\sigma_{\psi^{\prime}} = 1.13 \pm 0.07 \pm 0.14$ $\mu$b, $\sigma_{\Upsilon{\rm(1S)}} = 54.2 \pm 5.0 \pm 6.7$ nb and $\sigma_{\Upsilon{\rm (2S)}} = 18.4 \pm 3.7 \pm 2.2$ nb, where the first uncertainty is statistical and the second one is systematic. The results are compared to measurements performed by other LHC experiments and to theoretical models.
Eur. Phys. J. C 74 (2014) 2974
HEP Data
e-Print: arXiv:1403.3648 | PDF | inSPIRE
CERN-PH-EP-2014-042
Figure 1
Dimuon invariant mass distribution in the region of charmonia (top) and bottomonia (bottom). Solid (dotted) lines correspond to signal (background) fit functions. The sum of the various fit functions is also shown as a solid line. For the J/$\psi$ and $\psi^\prime$, a combination of two extended Crystal Ball functions is used for the signal and a variable width Gaussian function is used for the background. For the $\rm\Upsilon$ resonances, a combination of extended Crystal Ball functions is used for the signals and two power law functions for the background. |  |
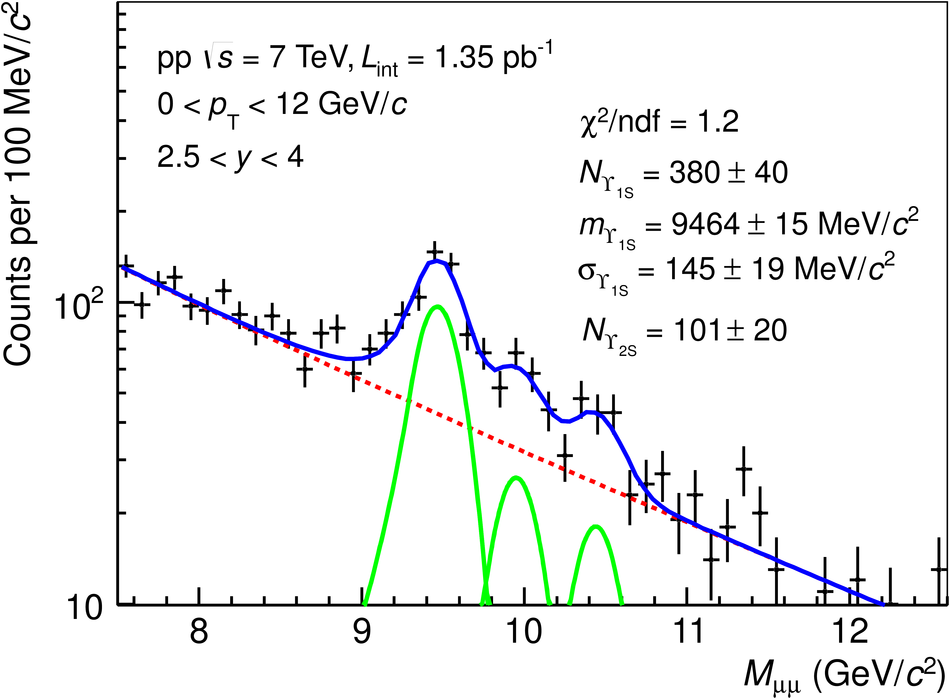
Figure 2
Differential production cross sections of J/$\psi$ (top) and $\psi^\prime$ (bottom) as a function of $\pt$ and $y$. The results are compared to previous ALICE results and LHCb measurements. The open symbols are the reflection of the positive-y measurements with respect to $y=0$. The vertical error bars and the boxes represent the statistical and systematic uncertainties, respectively. | 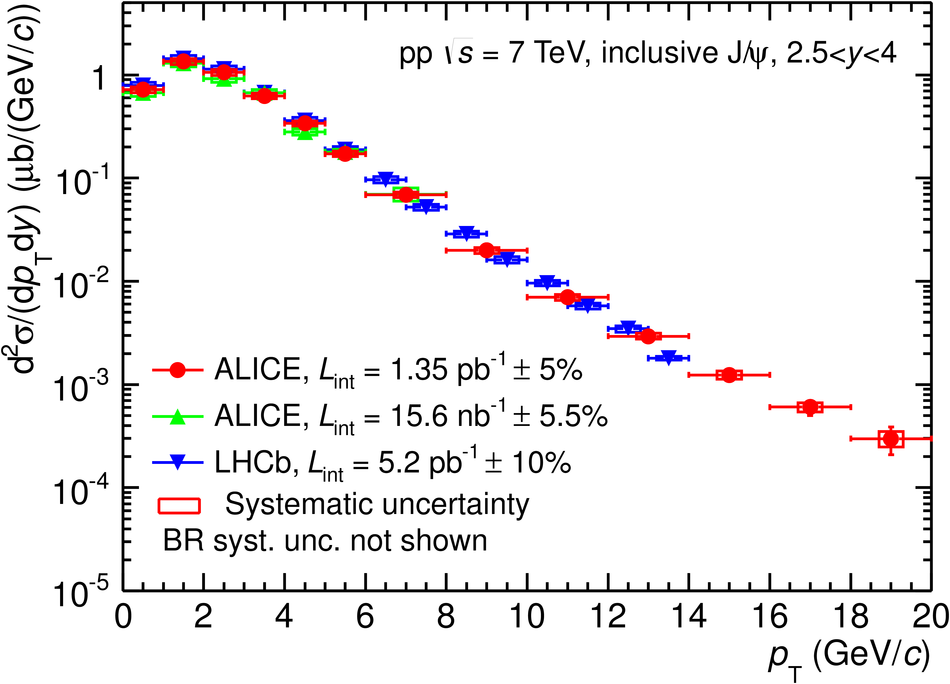 |
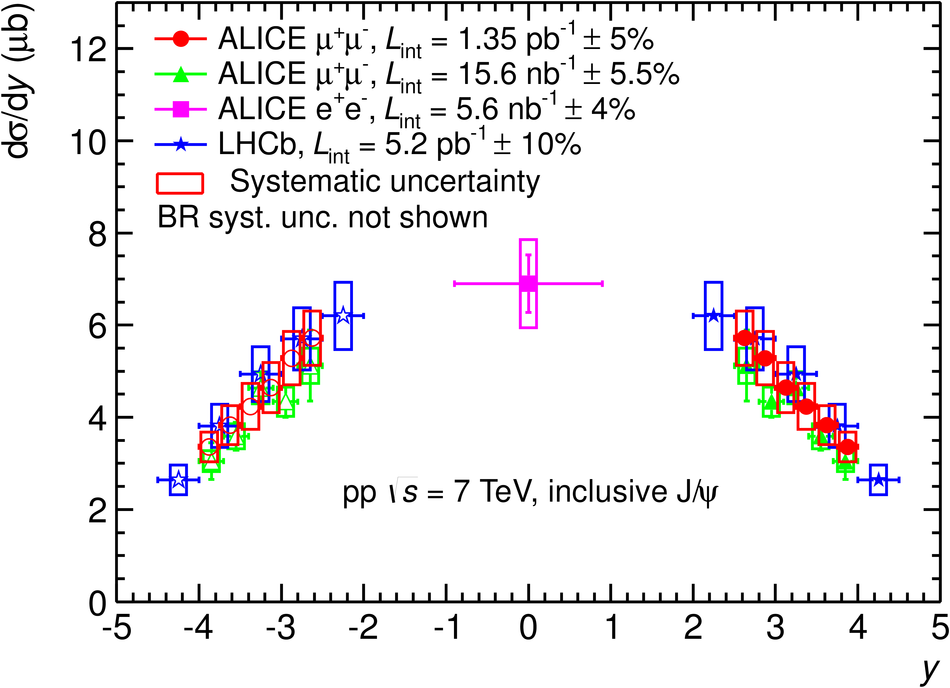
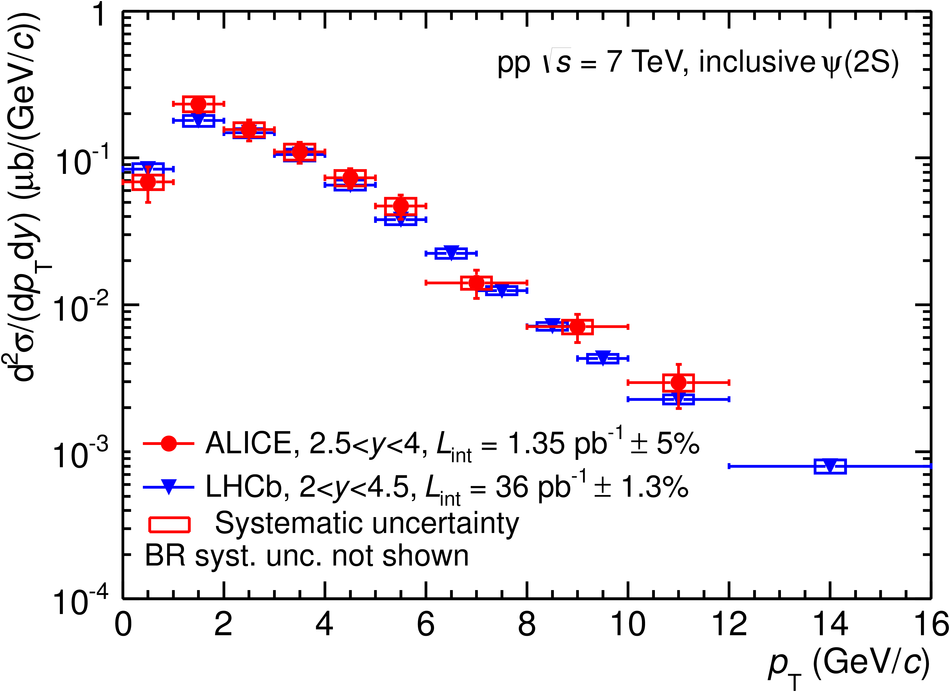
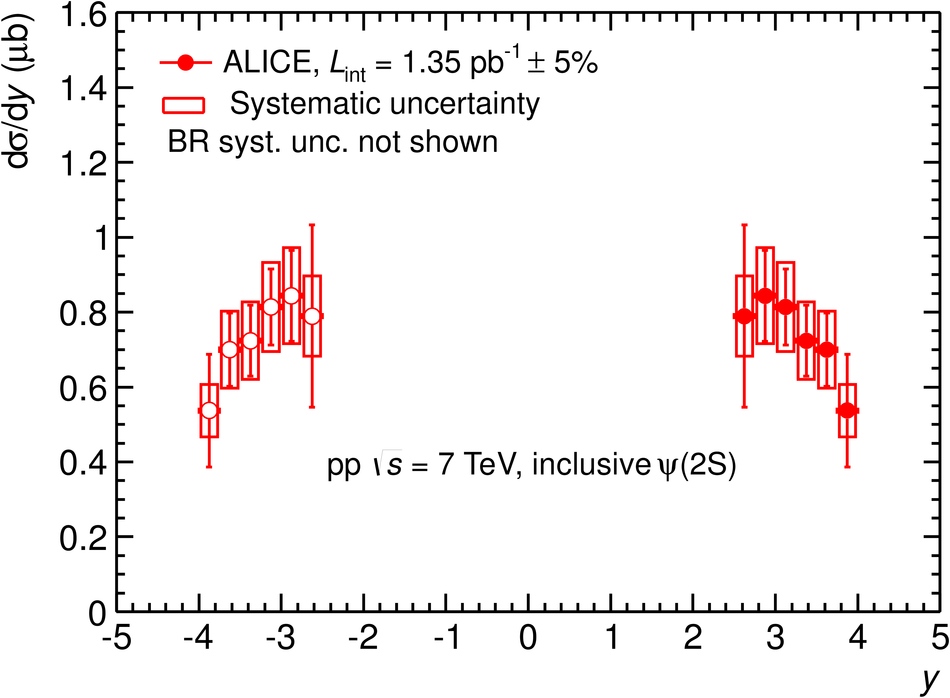
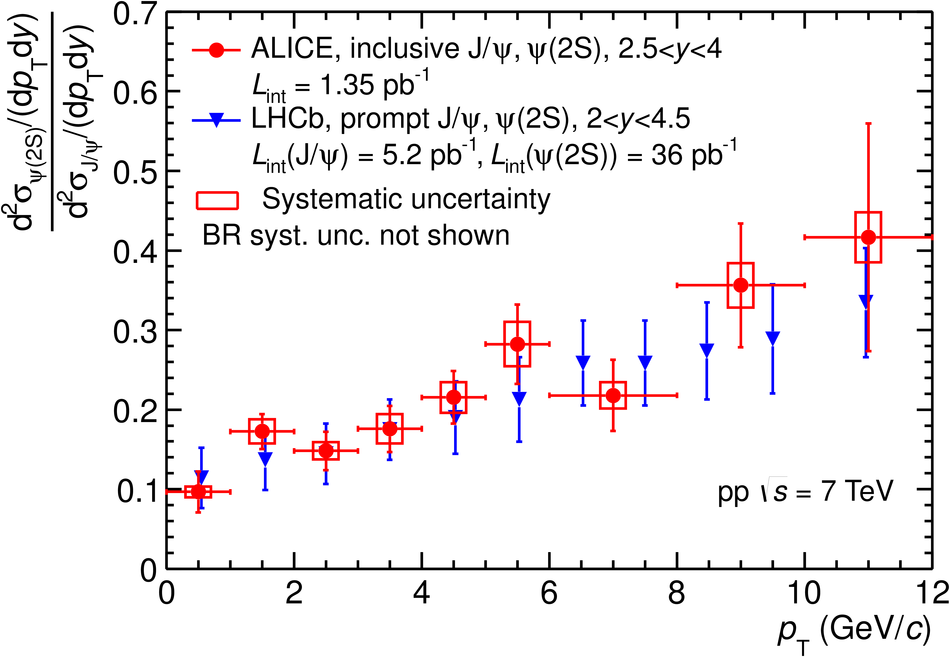
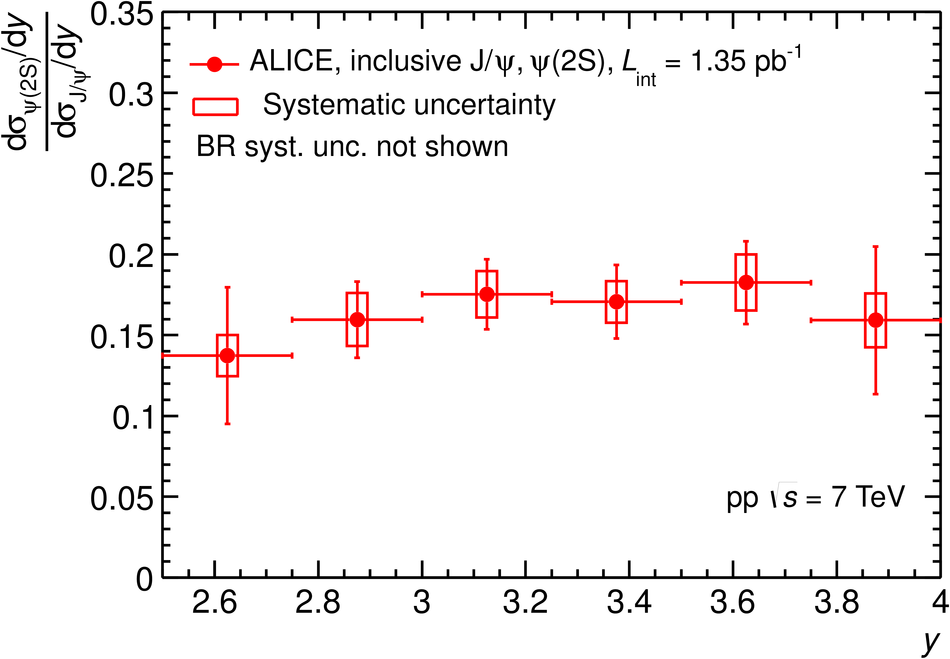
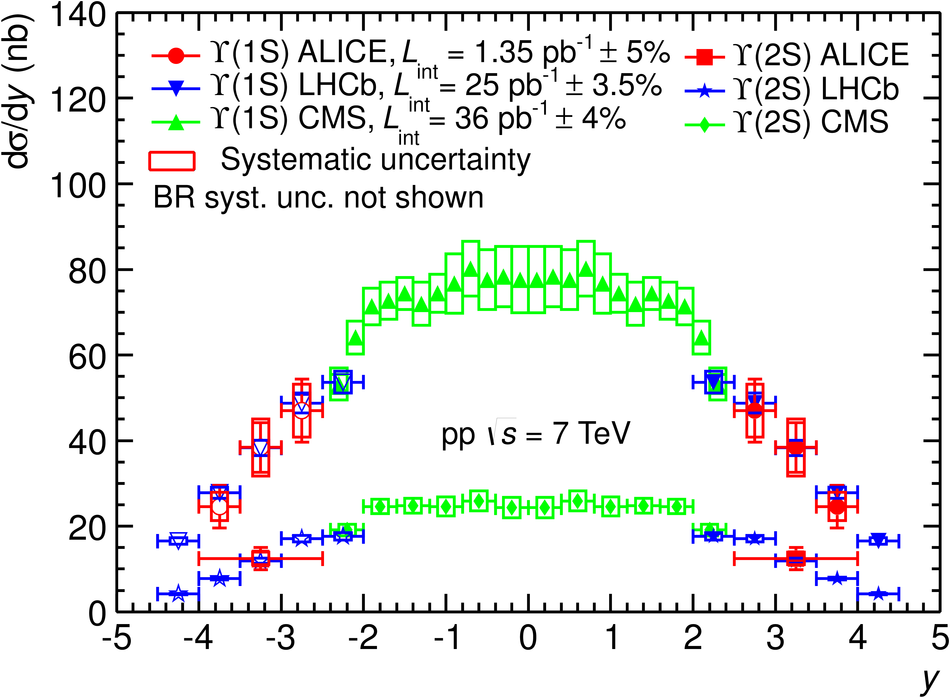
Figure 6
Inclusive J/$\psi$ differential production cross section, inclusive $\psi^\prime$ differential production cross section and inclusive $\psi^\prime$-to-J/$\psi$ ratio as a function of $\pt$ compared to two different NRQCD calculations. | 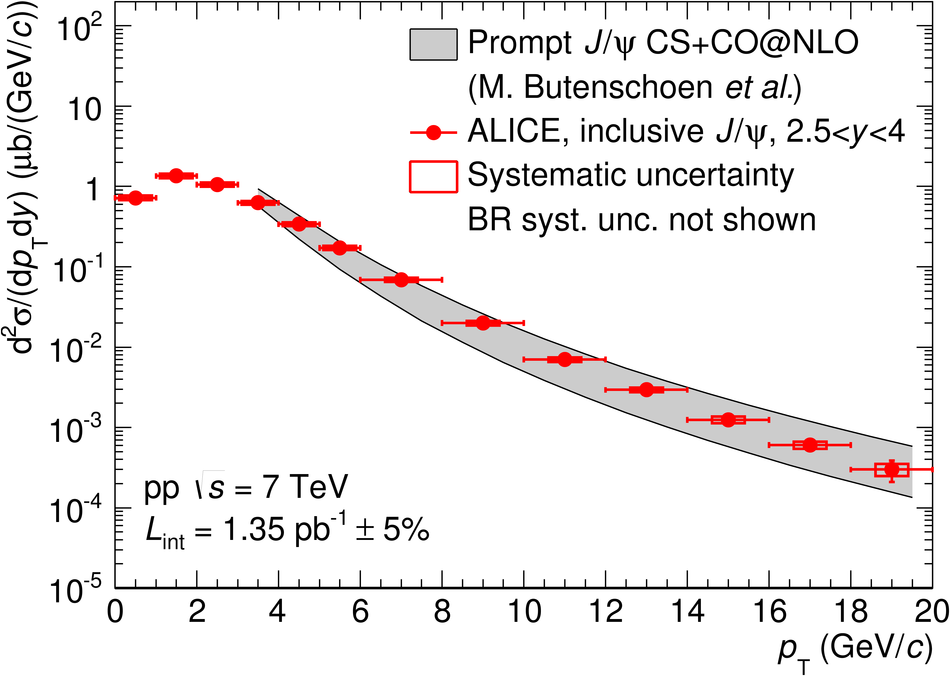 |
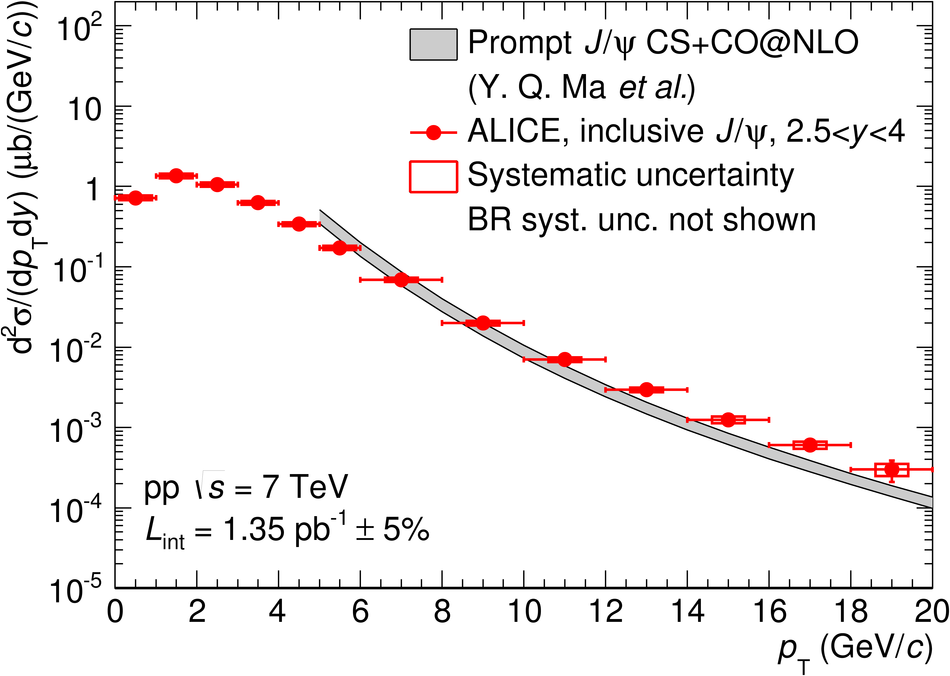
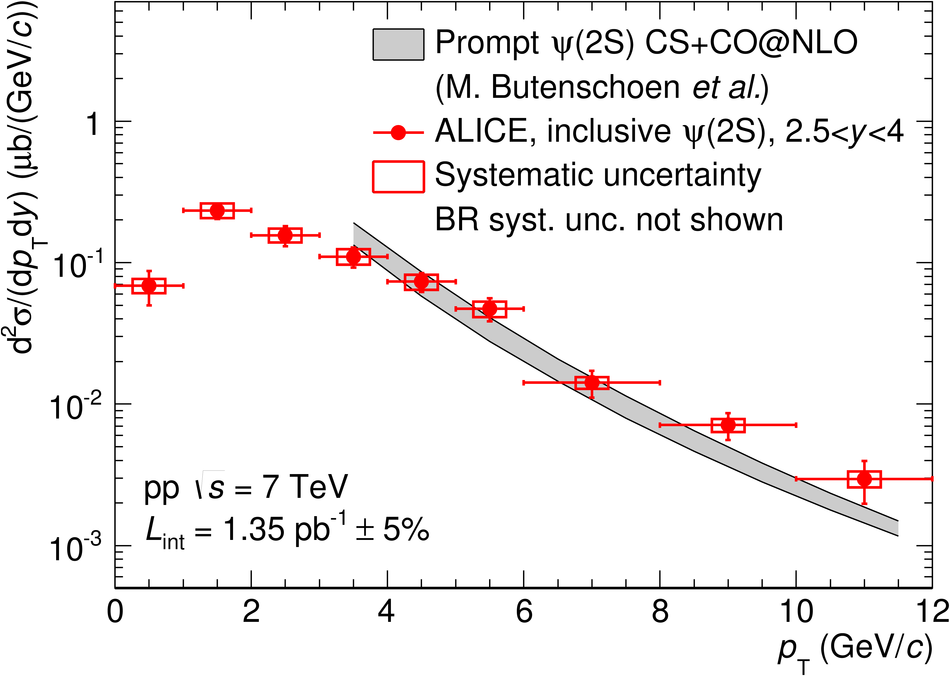
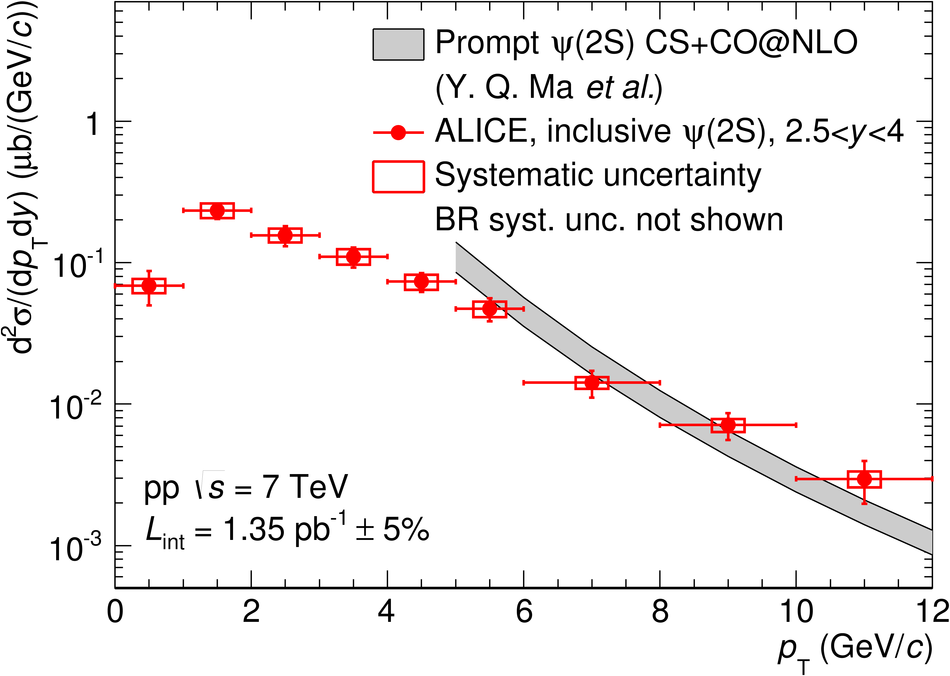
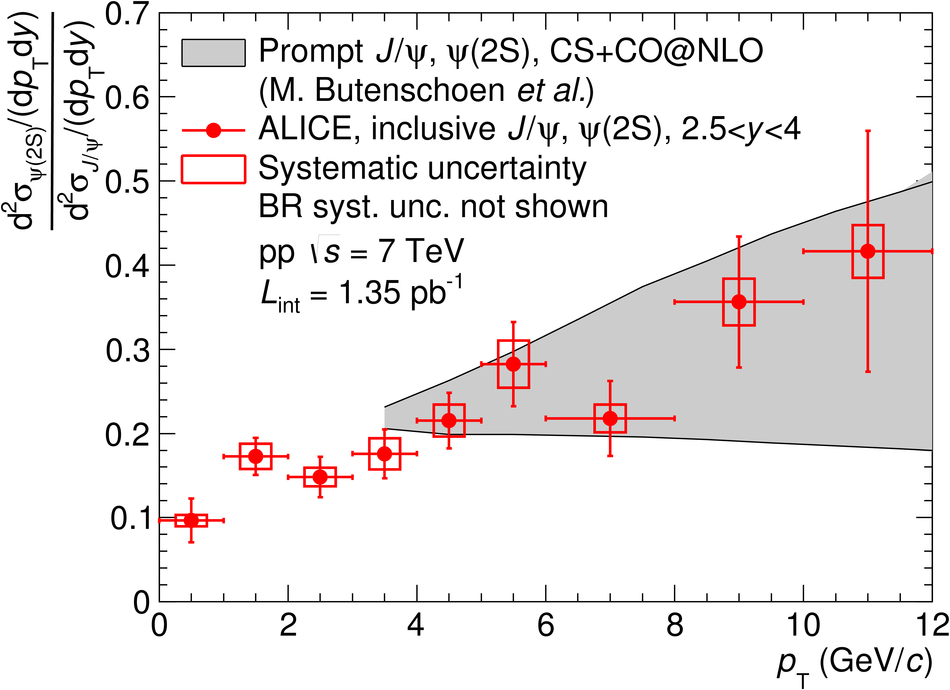
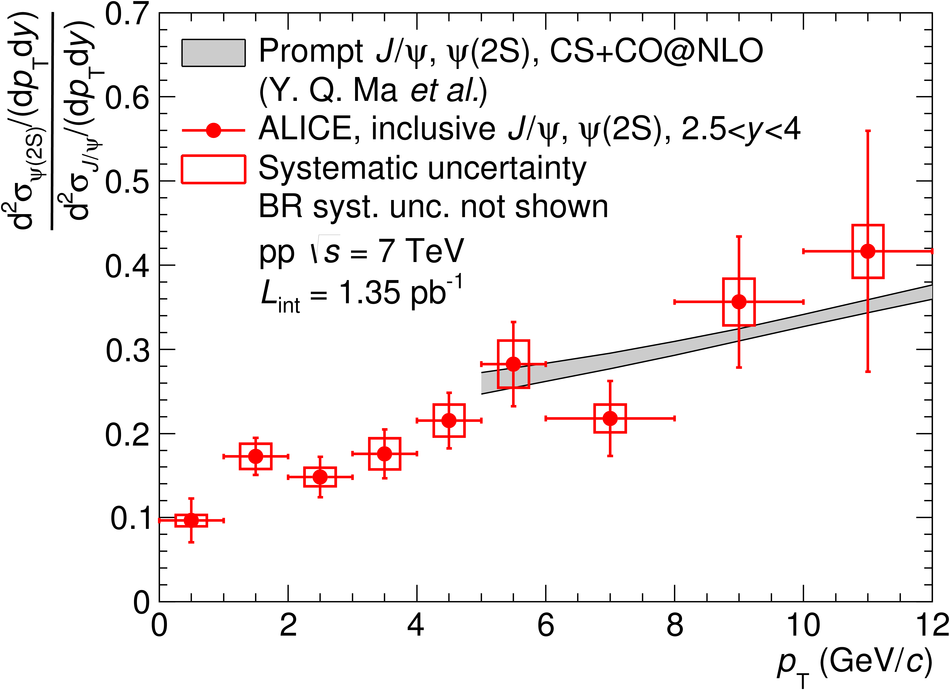
Figure 7
Inclusive $\psi^\prime$-to-J/$\psi$ cross section ratio as a function of $\pt$ compared to a simulation in which all direct quarkonia are considered to have the same $\pt$ distribution and only kinematic effects due to the decay of higher mass resonances are taken into account, using PYTHIA. | 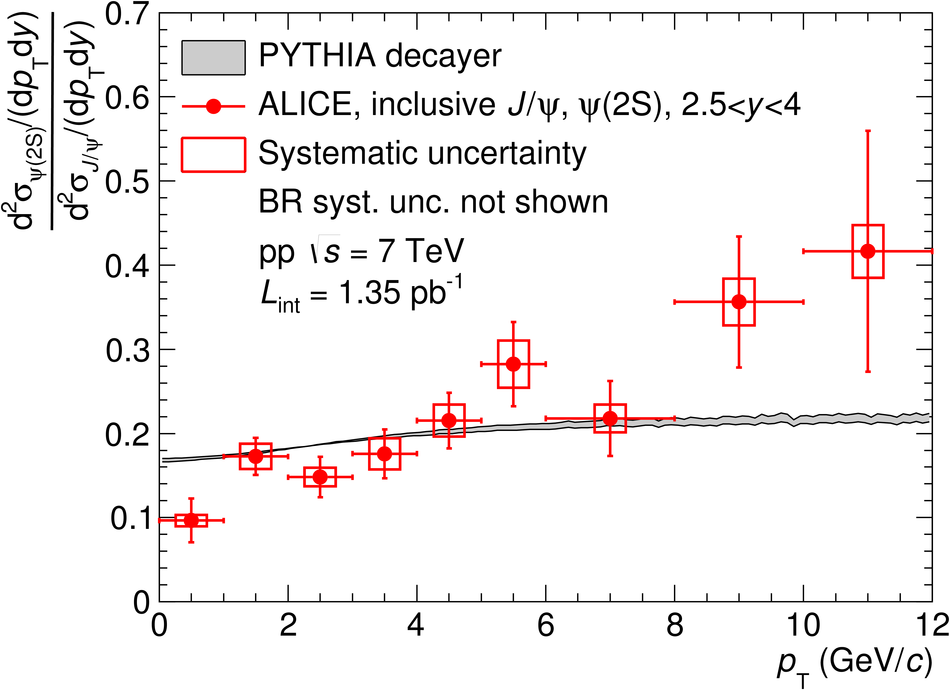 |